|
"The door to the past is a strange door. It swings open and things
pass through it, but they pass in one direction only. No man can
return across that threshold, though he can look down still and see
the green light waver in the water weeds."
- Loren Eiseley
8. The Cycle Of Prices
Every time you make a major purchase you are, at least partially,
trying to forecast the future price of that item.
Should you buy that new home now, or wait for real-estate prices to
go down? Of course, they might go up. Should you trade your
automobile now, or will you get a better price deal in December?
Corporations try to anticipate the moment when their new bond issue
will bring the best possible price and housewives are always trying
to outguess the supermarket manager.
Prices are affected by many forces, such as inflation, war, supply
and demand, devaluation of currency, price controls, and changes in
tariff laws. But underlying all these obvious and well-known causes
is the mysterious and imposing force called rhythm.
Since World War II, prices have incessantly climbed to higher and
higher plateaus, but even in their relentless upward movement they
bob up and down in a behavior pattern that gives evidence of rhythm.
They fluctuate, for the most part, in cycles, and this strange
behavior seemingly has nothing to do with supply and demand,
inflation, or any of the other well-known economic forces.
You cannot afford to ignore this inexplicable rhythmic behavior or
you will be driving blindly through life. It is as if you were at
the wheel of an automobile, driving backward at a speed of sixty
miles per hour on a winding road with your accelerator stuck and
your brakes out of order. To add to your predicament, you have no
rear-view mirror and you cannot turn your head to look at the road
you are about to travel. All you can do is glance out of your side
windows - and that's about all you can do when you look at today's
prices.
In real life you can see what is happening now... but you cannot
see, even one minute ahead, what will happen. Moreover, you are
always being propelled, irresistibly, at a constant speed of sixty
minutes to the hour. You can't stop, you can't pause, you can't even
slow down. And, like your suicidal automobile trip, if you don't
guess right, you may be in for serious trouble.
Of course, in driving your automobile backward you might spot a clue
or two which would help you decide the curves in the road. Perhaps
to your right there are converging hills and to your left there is a
stream running parallel to the road. Telephone poles might appear
every so often, if you don't hit one of them.
In forecasting the future price of anything you have clues of this
sort too, but the odds are still fifty-fifty that you will guess
wrong. Ask any expert trader in the commodity and stock exchanges
and he will quickly corroborate one fact that is so obvious that it
is usually ignored - nearly every transaction involves one correct and
one incorrect forecast of the future price of that item.
Nearly
every commodity price, every stock price, and anything else you care
to name is either going up or down, perhaps in the next hour, the
next day, the next week. Whenever a trade is made, one of the two
parties involved, either the buyer or the seller, has guessed wrong
about the future price of whatever was traded, despite all the facts
and advice that are available.
But... what if, while driving "blind" and backward, unable to see
what is approaching, you suddenly realize that your road has a
pattern? Wouldn't it be amazing if you discovered that it has
structure and, insofar as this structure can be learned, the coming
bends of the road are predictable?
Cycles have this structure, and although we still have much to
learn, they can be used now to help us make forecasts. And
regardless of how good or how practical the forecasts may be, the
wondrous thing is that from internal evidence alone they can be made
at all! We will improve our results as we learn more about our
mystery and its cause.
Joseph, in biblical times, predicted a cycle of seven fat years
followed by seven lean years, and the Pharaoh followed his advice to
store up surplus food during the years of plenty so that there would
be ample food during the years of shortage. After Joseph, the world
waited several thousand years before another man was to come along
and point out cycles in commodities and their prices. The Pharaoh
listened to Joseph.
The world has yet to heed the words of Samuel
Benner. Joseph, presumably, had rare gifts of prophecy.
Benner had
only figures, graphs, and charts.
The Prophet from Bainbridge
Samuel Turner Benner was born at Bloom Furnace, Ohio, in 1832. As a
youth he worked in his father's iron works and after his Civil War
service he married a senator's daughter, Ellen Salts, and became a
prosperous hog and corn farmer in Bainbridge, Ohio.
In 1873 he suffered two setbacks over which he had no control. Hog
cholera and the 1873 panic drove Sam Benner into bankruptcy.
Penniless, he accepted help from his father-in-law, and with their
only son, Stephen, the Benners moved to a farm in Dundas, Ohio, that
had been placed in his wife's name.
Benner continued to farm, but now his mind was on other matters. He
was determined to learn what caused panics, what caused the ups and
downs in prices, and how to stay prosperous through good times and
bad. In 1875, at the age of forty-three, he copyrighted his famous
Prophecies, which were published under the title of Benner's
Prophecies of Future Ups and Downs in Prices.
Yearly thereafter he
added postscripts and supplemental forecasts until 1907. He died in
1913 at the age of eighty-one, and someday history will proclaim him
the father of cycle study in America, for he, like Leeuwenhoek with
his microscope, opened up a completely new world of knowledge.
Leeuwenhoek's discovery of microbes did not benefit mankind until
200 years after his first observations. Hopefully the world is no
longer on that same timetable, for we cannot afford to wait the 200
years until 2075 to convert Benner's discoveries of 1875 into a
force for good. The world cannot continue to drive blindly for
another century.
Benner's major contributions to the knowledge of cycles were in
the price fluctuations of pig iron and corn. He discovered a
nine-year cycle in pig-iron prices with high prices following a
pattern of eight, nine, and ten years and then repeating, with lows
following a pattern of nine, seven, and eleven years and then
repeating (see Figure 26).
Had you traded pig iron from 1875 to 1935 on the basis of Benner's
cycle you would have made forty-four times as much as you lost.
Since 1939 Benner's forecast has not fared well. The true length of
the cycle in pig-iron prices, as we now know, is 9.2 years instead
of nine years, and Benner admitted that he did not know how to deal
with cycles of fractional length.
Gradually Benner's forecast got out of step with reality, but he
never expected his original forecast, made in 1875, to hold true for
more than twenty years. Were Benner still alive and issuing yearly
supplements to his Prophecies, he probably would have learned all
that was necessary to know about cycles of fractional length and
would have adjusted later forecasts accordingly.
This chart is based on the work of Samuel Benner, first published in
1876. It was so accurate in forecasting the pig-iron price cycle
that it had a gain-loss ratio of 44 to 1 up to World War II.
But we do not need to provide this great pioneer with any alibis.
Benner's accurate forecast of pig-iron prices for sixty years is the
most notable forecast of prices in existence. He also discovered
cycles in cotton, wheat, and pork prices, and a cycle in panics or
depressions averaging eighteen years in length.
I ask you to keep
that length in mind as we explore our Foundation files for some
other examples of cycles in various phenomena.

Fig. 26.
Benner's 9-Year Cycle
in Pig-Iron Prices, 1834-1900
This chart is based on the work of Samuel Benner, first published in
1876.
It was so accurate in forecasting the pig-iron price cycle that it
had a gain-loss
ratio of 44 to 1 up to World War 11.
The Fifty-Four-Year Cycle in European Wheat Prices
Cycles, November 1962,
"One of the reasons that people believe in
the reality and significance of the 54-year cycle is the fact that
Lord Beveridge discovered a cycle of this length in his famous
periodogram analysis of European wheat prices, 1500 to 1869.
"...As so much of the belief in the significance of the 54-year
cycle in all sorts of things depends upon this work of Lord Beveridge, I thought it desirable to examine his figures to see if
there was a rhythmic cycle of this length actually present in his
figures. I have done so. The result is shown [Figure 27].
Unquestionably, the figures do evidence a rhythm... the ups and
downs do repeat time after time with a beat.
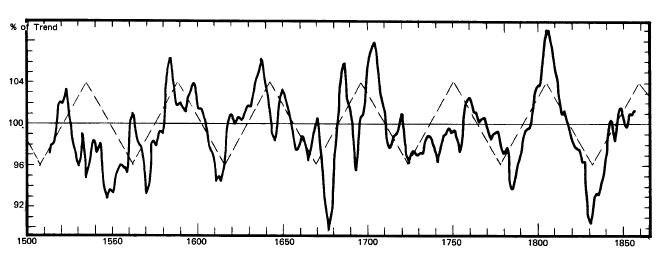
Fig. 27.
The 54-Year Cycle in European Wheat Prices, 1513-1856
"...This does not mean that the crests and troughs come exactly
54 years from each other. The actual highs and lows are distorted,
one way or another, by randoms and other cycles. There is, however,
a tendency for areas of strength to follow each other at 50 to 60
year intervals and for such areas of strength to be separated by
corresponding areas of weakness. As we look at the chart we see
strength, weakness, strength, weakness, etc., repeated time after
time across the page. Fifty-four years is the length of the
perfectly regular cycle that most nearly fits these various
successive waves.
"...The 54-year cycle discovered by Lord Beveridge therefore is
not a statistical abstraction; it does refer to a physical reality.
It is a reality in the United States, also.
"...Wheat prices in England are readily available from 1259.
These longer series of figures have also been studied, and the
54-year cycle persists throughout... adding even more credence to
the significance and the permanence of this important cycle."
Three months later I commented further about England's wheat-price
cycle:
Cycles, February 1963,
"Of course, it is not surprising that from
1500 to 1869 English and European wheat prices behaved more or less
the same way, but my recent work adds new elements to the picture.
First, in England, the wheat prices from 1500 to 1869 really had
rhythmic waves, something that Beveridge's work had not gone far
enough to show. Second, I discovered that the
waves had continued forward from 1869 to 1940 and backward from 1500
to 1260! Lastly, over this much longer span of time the length
really did seem to hold up very close to 54 years.
"I hope you realize what a very stupendous thing it is that a rhythm
should persist in a price series for over 700 years. The year 1260
is very long ago. It is a mere 200 years after the Norman conquest;
a full 200 years before the discovery of America; more than 400
years before the Industrial Revolution. Yet, over this long period
of time... through wars, expansion, change from a feudal to a
freehold agriculture and from a freehold agriculture to an
industrial economy... the beat of 50 to 60 years has continued
and has dominated!
"... A few years later, in 1949, studying some figures relative to
the thickness and thinness of Arizona tree rings, I discovered that
these figures, too, from 1100 to date, had what seemed to be a
54-year cycle. Here was something really important. If a natural
science phenomenon like tree-ring widths has the same cycle as
economic phenomena, we are on notice that we may be dealing with
something much more fundamental than the mere ebb and flow of human
price and production behavior."
In 1926 N. D. Kondratieff, Director of the Conjuncture Institute of
Moscow, published a paper that announced that throughout the Western
world economic phenomena went up and down more or less together in
oscillations that had been, for the last two or three waves, about a
half-century long. His work posed questions whose answers we are
still seeking.
Why do economic affairs fluctuate in rhythm? Why do
economic affairs in all these divergent countries go up and down
together?
What is the cause?
The 3½ - 3¾-Year Cycle in Corn Prices
Cycles, October 1955 - "With a few minor exceptions corn prices in
America are available from 1720 to the present. [Prices prior to the
Revolutionary War were converted from British shillings for this
cycle study.]
"... There are a powerful lot of months from January, 1720, to
December, 1954, 2,820 to be exact.
"... Even the most casual study of a chart of corn prices, 1720
to date, shows evidence of a cycle a little less than four years
long which repeats time after time with reasonable regularity."
This cycle has behaved in a unique manner since 1720, a behavior not
calculated to make our job any easier. It changes its rhythm!
After
two 4¾ year waves it averaged 3⅔ years from top to top for
twenty-five repetitions, until 1826. Then it shortened its beat to
3½ years for five repetitions. Then, just as suddenly, its length
became 4½ years for four repetitions to 1860.
From 1860 it has
settled down to a regular 3½ years (see Figure 28) for twenty-five
repetitions! Neither the early cycle of 3⅔ years, repeating for
ninety-two years, nor the recent cycle of 3½ years, repeating for
the past ninety-five years, behaved with such amazing regularity
purely by chance.
But what force caused the cadence to change?
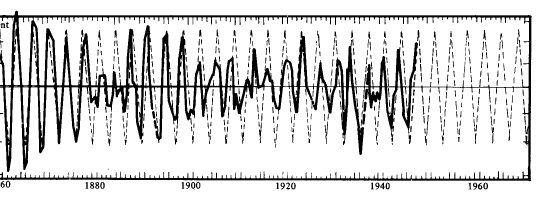
Fig. 28.
The 3½-Year Cycle in Corn Prices, 1860-1948
The 17¾-Year Cycle in Cotton Prices
Cycles, January 1955 - "Cotton prices for over 220 years have been
characterized by a rhythmic cycle about 17¾ years in length [see
Figure 29].
"... The typical cycle crests ideally in November, 1775, and every
17.75 years thereafter.
"... You must not think of this cycle (or any other cycle) in terms
of its ideal crest. Think of it rather in terms of areas of strength
and areas of weakness.
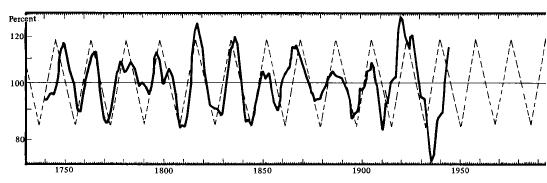
Fig. 29.
The 17¾-Year Cycle in Cotton Prices, 1740-1945
"... In the past we have had 21 tops and bottoms... 15 came on
time or within 2 years of perfect timing, 4 came 3 years one way or
the other of perfect timing, 1 was 4 years off and 1 was 5 years
off.
"... Let me remind you, again, that the 17¾-year cycle in cotton
prices is only one of many cycles present in these figures. It's
like the shortening in a pie crust, important as an ingredient in a
forecast, but by itself it doesn't taste very good. If, however, you
combine the 17¾-year cycle in cotton prices with the 5.91-year
cycle in these figures, you can expect results better than by using
either alone. If you add in more cycles, you could hope for an even
better forecast."
I hope you took special note of the previous paragraph.
It is
included from the original 1955 article for a special reason. In it,
and for the first time in this book, you are being put on notice
that many phenomena have more than one cycle length and act as if
they were influenced simultaneously by more than one cyclic force.
We will return to this unsettling notion a little later.
The 16⅔ -Year Cycle in English Wrought-Iron Prices
Cycles, May 1955 and July 1967 - "Wrought iron prices in England,
1288 to 1908, clearly evidence a cycle about 16^4 years in length
[see Figure 30].
The figures cover a long enough period of time so
that the cycle has repeated 38 times during 642 years.
"... When a rhythmic cycle persists in spite of changed environmental conditions we have additional evidence that it is of a
non-chance nature.
"... Note that this cycle has remained a constant characteristic
of these figures from before the Industrial Revolution, through the
Industrial Revolution, and up into the era of modern technology.
"... Except for a few abnormalities scattered here and there over
the 642-year period, the conformation to the perfectly regular
pattern is quite astonishing."
Fig. 30.
The 16 2/3-Year Cycle in English Wrought-Iron Prices,
1288-1908
Study this chart carefully. You will note that although the cycle
was distorted
on more than one occasion the pattern always
reasserted itself in step with previous behavior,
an important clue
that the cycle is much more likely to be non-chance or significant.
The 17¾-Year Cycle in Pig-iron Prices
Cycles, April 1955 - "Pig iron prices, 1784 to date, have been
characterized by a rhythmic cycle about 17.7 years long [see Figure
31].
The span of time for which data are available (171 years) is
enough for nine-and-a-half repetitions of the cycle.
"... Pig iron prices act as if they were influenced by a number of
cyclic forces."
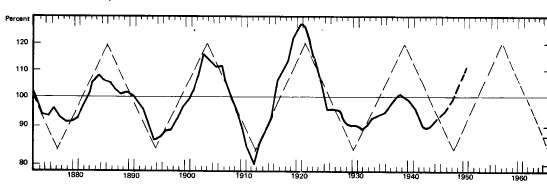
Fig. 31.
The 17¾-Year Cycle in Pig-iron Prices, 1872-1950
Two Strange Facts of Life
Why are there different cycle lengths in different things? Why, for
example, does the price of cotton have a 1734-year cycle while corn
prices fluctuate in a 3 \/2 -year rhythm?
The answer is simple. No one knows!
For that matter, no one knows why strawberries respond to red light
waves, plums to blue light waves, and bananas to yellow light waves.
All three colors of light are equally available but strawberries,
plums, and bananas are selective. So are wheat prices, cotton
prices, corn prices, and all the other phenomena that respond to
cyclic forces.
Most stock prices, as you will discover in the next
chapter, fluctuate independently of one another, just as the various
organs in your body have distinct and different rhythms. For now we
can only accept this difference in cycle lengths as a fact of life
just as we accept the sunrise and the sunset.
But there is another fact of cycle life that is even more
perplexing. Nearly every phenomenon seems to have more than one
cycle, as if it were being influenced by a number of different
forces, all acting on it at the same time.
As you have learned, corn prices have a 31/2-year cycle. But they
also have a longer 514-year fluctuation that was discovered long ago
by Samuel Benner.
Cotton prices, you have just read, have a 173/^-year cycle. But they
also have longer price cycles of fifty-four years and thirty-seven
years and they have shorter cycles of 12.8 years, eleven years, 8.5
years and six years.
There are possibly others, and it is this
complexity of rhythms, all going up and down with different beats,
that causes all but the stoutest hearts to abandon the search for
the cause of cycles and go off in pursuit of something less
difficult, like the fountain of youth or the lost continent of
Atlantis.
And yet this concept will be easy for you to grasp when we consider
weather as a perfect example of something with many cycles. Let's
take the amount of rainfall at Anyplace, U.S.A. If we analyze the
record of rainfall in this mythical city over a period of many years
we will discover many cycles. The first of these is the yearly
cycle. Some months have less rainfall than others and there is a
normally dry season and a normally wet season.
Next, consider that some years as a whole are drier than others. If
the dry years and wet years alternate we would also have a two-year
cycle.
Now, the records of rainfall at Anyplace might indicate that, on the
average, every other decade was drier than the one in between. This
would give us a twenty-year cycle. And some centuries might be, on
the average, drier than others - a 200-year cycle.
In our hypothetical case your dry periods from the one-year,
two-year, twenty-year, and 200-year cycles will all coincide from
time to time. There would be a dry month in a drier than normal year
in a drier than normal decade in a drier than normal century. The
opposite could also happen with all the wetter than normal periods
coinciding.
Then there would be various mixtures of the wet and dry cycles. They
might, at times, cancel each other out. At other times they might
partially cancel each other out, and leave one or two cycles to
dominate the scene. The situation would then become difficult to
unravel with all the various cycles operating at the same time,
reinforcing each other, canceling each other, and all mixed together
in a seemingly unfathomable maze of ups and downs.
Yet this situation is not unfathomable. Once the different-length
cycles have been discovered and isolated, it is neither difficult
nor complicated to combine them, through simple arithmetic, into a
synthesis - one line representing the sum of all their different
fluctuations and project this line into the future. Let's look at a
fairly simple example from Cycles, September 1958, dealing with the
price of oats.
In an earlier analysis, covering the price of No. 3 white oats at
Chicago from January 1923 through May 1958, we had discovered a
cycle of 26.64 months. An ideal cycle of this length is plotted in
Figure 32 as A.
There is also a twelve-month seasonal cycle in oat prices. An ideal
cycle of this length is plotted as B.
If we combine these two cycles, we have a curve (a line) that looks
like C.
The general trend of oat prices during this period was downward, as
you can see in D.
When we combine this downward trend with A and B, we have a line
that looks like E. Line E is reproduced again at the very bottom of
the graph, and a heavy line of the actual price of oats from 1950
through April 1958 is superimposed on it. As you can see, by using
only two cycles and the price trend line we did not come too far
from the actual results. The variation between the two could have
been caused by other unknown and still undiscovered cycles or
randoms in the series of figures.
Our dotted line (E) was also extended through 1959 as a forecast,
assuming that the two cycles would continue and that the price of
oats would continue in its downward trend. Of course, either of
these conditions could change. The downward trend of oat prices
might reverse itself, or our two cycles could be overcome by a
stronger cycle of some other length, still unknown.
There could be many still undiscovered
cycles in the price of oats.
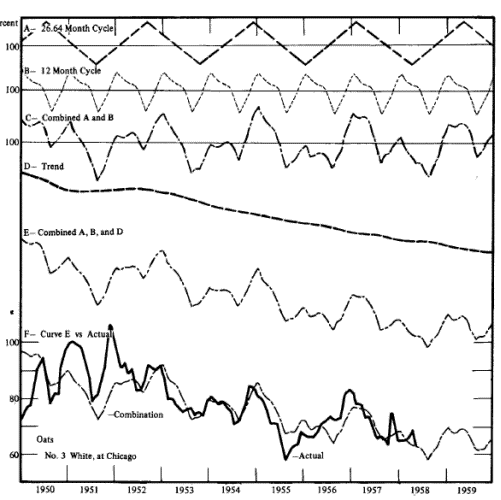
Fig. 32.
The Price of Oats, 1950-1959
Note how two cycles in the prices of oats are combined with the
trend,
and compare this combination (dotted line) with the actual
price (heavy line) in the bottom portion of chart.
The
government could also intrude to tamper with oat prices. War might
affect the price. Thus if you were interested in oats, you would
stick closely to your graphs, constantly making adjustments as
Samuel Benner might have done with his yearly supplements.
This particular graph somewhat reminds me of Edison's early
incandescent light.
Many improvements and refinements will be made
as our knowledge increases - but it does shed some light, dim though
it may be, in the darkness. You can use the information even in its
present far from absolute state provided you treat it only as a
probability of what is to come, not as an absolute certainty.
All of us make use of probabilities every day. The weather man says
there is a 70 percent probability of showers, so we take our
raincoat and umbrella. The probabilities are 8 to 5 that Notre Dame
will defeat Michigan State, and so we wager on Notre Dame if we can
get even money. The probabilities are that it will start getting
cold in October, so we make certain that our furnace is checked and
serviced in September.
The probabilities are that next winter will
be colder than last, so if you operate a natural gas company, you
drill another well or two. The probabilities are that after 100,000
miles your car will begin giving you trouble, so you trade it in for
a new one even though it is still running well.
Exactly the same sort of approach is required to make use of rhythm
knowledge. This knowledge, incomplete as it still may be, can be
invaluable when combined with business acumen and some common sense.
The late General Charles Gates Dawes, former Vice President of the
United States, former chairman of the board of the City National
Bank and Trust Company of Chicago, and until his death a member of
the board of directors of the Foundation for the Study of Cycles,
once told me that he and his brother had made over a million dollars
in the market solely as a result of his knowledge of cycles. He
showed me brokerage statements that indicated more than this amount
in clear profit.
Obviously he offered the best kind of proof that cycles can be a
tremendously useful tool for the investor and businessman.
Back to Contents
|


