|
"A mob is usually a creature of very mysterious existence....
Where it comes from, or whither it goes, few men can tell.
Assembling and dispersing with equal suddenness, it is as difficult
to follow to its various sources as the sea itself; nor does the
parallel stop here, for the ocean is no more fickle and uncertain,
more terrible when roused, more unreasonable or more cruel."
- Charles Dickens
6. The Mob Cycles
The word "mob" traces its ancestry to the Latin mobile vulgus, the
movable common people. Mobs come in various sizes and personalities.
They can be lawless, disorderly, passive, angry, warlike, organized,
leaderless, fanatic.
No severe stretching of the imagination is required to picture
mankind, in the mass, as a mob, even in some of its more peaceful
pursuits.
Emerson once wrote, "It seems as if heaven had sent its insane
angels into our world as to an asylum. And here they will break out
into their native music, and utter at intervals the words they have
heard in heaven; then the mad fit returns and they mope and wallow
like dogs." Why we act this way and what force triggers our actions,
usually in cycles, is the purpose of this inquiry. Our investigation
throughout the remainder of this book will focus on behavior in the
mass rather than on individual phenomena. We are searching for the
forces that command the "movable common people."
We Excitable Humans
Shortly after World War I a brilliant Russian, Professor A.L. Tchijevsky, published a book with a title guaranteed never to appear
on any theater marquee: Investigation of the Relationship
Between the Sunspot Activity and the Course of the Universal
Historical Process from the V Century B.C. to the Present Day.
Tchijevsky's premise was that disturbances on the sun - sunspots -
which occur in greater number every eleven years, cause mass
excitement here on earth.
First, of course, Tchijevsky had to show that mankind did, indeed,
suffer periods of unrest every eleven years - a monumental task. The
professor conducted long and detailed studies of the statistics and
histories of seventy-two countries from 500 B.C. to 1922, a period
of 2,422 years.
He included in his compilations such signs of human
unrest and excitability as wars, revolutions, riots, expeditions,
and migrations, plus such factors as the number of humans involved,
the quality of the event, and the size of area affected.
The time
when the unrest began and its high point were also reduced to
arithmetical values of varying significance.
With his volumes of data Professor Tchijevsky constructed a
year-by-year Index of Mass Human Excitability that covered the past
twenty-four centuries in an amazing panorama of man's emotional
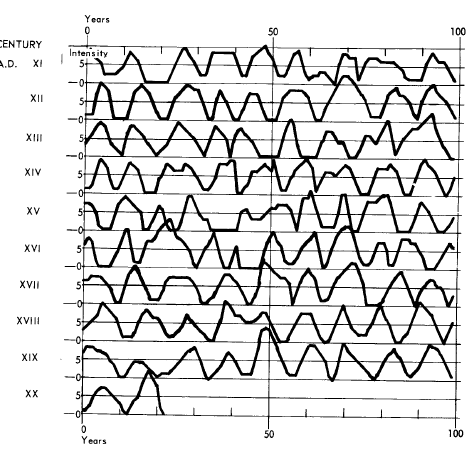
moods (see Figure 7).
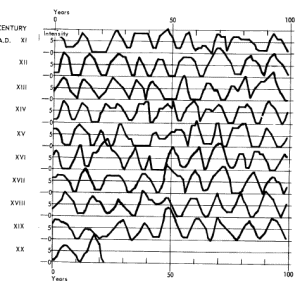
Fig. 7.
Mass Human Excitability, 500 B.C.-A.D. 1922
Professor A. L. Tchijevsky's Index of Mass Human Excitability.
Note
tendency for nine waves in each century.
As you can see, the Index fluctuates in waves that tend to number
about nine per century and, on the average, each wave is about 11.1
years long.
Tchijevsky's analysis indicated that each eleven-year cycle has four
components.
-
The first period, lasting approximately three years, has
a minimum of excitability and is characterized by peace, tolerance,
passiveness, lack of unity, and autocratic rule by minorities.
-
This is followed by a two-year period in which excitability grows.
The masses begin to organize under new, revolutionary leaders. They
challenge political and military decisions with new concepts,
usually centering around one theme and encouraged by the press.
Various leaders arise in local situations with no apparent loyalty
or alliance uniting them with other pockets of unrest.
-
The third period, approximately three years in length, is one of
maximum excitability, but one which solves the most pressing
problems of the era. Often these outstanding achievements are
accompanied by the strangest insanities.
Revolutions and wars
abound, splinter groups congeal under one hypnotic leader, great
military, political, and spiritual leaders emerge, and the people's
voice is heard.
The masses riot, bloody conflicts are commonplace,
and the old establishment, in a most paralyzed state of inaction,
offers only feeble resistance and is destroyed. Anarchy prevails but
the fruits of its action are democratic and social reforms.
-
The fourth period, approximately three years in length, witnesses a
gradual decrease in excitability until the masses are almost inert
and apathetic.
"Peace" is their cry, and their unity, so evident
during the struggle, disappears. They slumber, like a bear in
hibernation, coma-like, awaiting a new season, a new cycle.
Although Professor Tchijevsky's Index extends only through 1922 you
might wish to place your finger on the bottom row, our twentieth
century, and move it across to this current year.
Then, although
this would not be completely accurate, move your finger up the page
to the corresponding time in other centuries, and make your own
conclusions about the validity of Tchijevsky's work as it relates to
the present.
Whether or not the good professor proved his hypothesis that
sunspots cause our unrest is something we will explore later when we
take a long look at our sun.
The Rhythmic Protestants
One evening early in 1950 the phone rang in my home in Riverside,
Connecticut.
A pleasant voice said,
"This is Harold Martin speaking.
I am pastor of the First Congregational Church of Norwalk,
Connecticut. I'd like to come to your office, whenever you can see
me, to show you some charts I've made that show the fluctuations of
new membership of various Protestant denominations and of various
individual Protestant churches. New membership seems to go up and
down in cycles, and I want your opinion in regard to what I've
discovered."
"Of course," I said, "I'd be delighted."
And so, in due course, Mr.
Martin appeared.
He had completed a prodigious amount of work with charts of new
members for the Methodist, Episcopal, Presbyterian, and
Congregational denominations. His figures extended back to the very
beginning of such figures, many well over one hundred years.
He also
had charts indicating the new membership of many individual
churches.
The first thing that Mr. Martin had discovered was that, regardless
of location, there is a tendency for additions to membership to go
up and down together.
For example, when people were flocking to join
the Congregational churches in Boston, they were also flocking to
join the Congregational churches in Norwalk, San Francisco, and
Seattle.
This national movement puzzled Mr. Martin, for he had always
believed that church membership increased or decreased in accordance with local situations. Undoubtedly local influences are
important, but Mr. Martin's work indicated that there were larger
forces, at least national in scope, that were also at work, and the
national forces seemed to have more strength and influence than the
local forces.
Here was something with startling potential significance to
evangelism in the churches. For if the forces that lead people to
church membership are not local, churchmen must discover what these
forces are and turn this information to use in expanding their
flocks.
The second discovery made by Mr. Martin was that additions to
membership in different Protestant denominations went up and down
more or less together. At times when great numbers of people were
joining Congregational churches, great numbers were also joining the
Methodist church, the Episcopal church, and the Presbyterian church.
Possibly he might have discovered this same movement in the Catholic
and Jewish faiths had he also studied their figures, although I have
no data on which to base my assumption.
The simultaneous movement toward denominations as such also
surprised Mr. Martin. He had assumed that increases in Methodist
membership would coincide with the coming of great Methodist
evangelists and that increases in Presbyterian membership would
coincide with the coming of great Presbyterian leaders. And indeed,
in the record, one can see the influence of great individuals.
But
beyond this one can also note general patterns of ebb and flow that
seem to affect all denominations simultaneously. These basic forces
seem to operate not only independently of geography but also
independently of creed.
Finally, Mr. Martin made a third discovery, and it was this
observation that brought him to Foundation headquarters. He
discovered that at least some of the ups and downs of new membership
in the various churches showed rhythm.
There was a tendency for man
to "return to God" every nine years - in a cycle (see Figure 8).
As you study these three charts here is an excellent opportunity for
me to show you how we locate a possible cycle. Although I must warn
you that this is an extremely simplified version of the
technique involved, you might wish to experiment with other figures
of your own, such as the annual sales of your company.

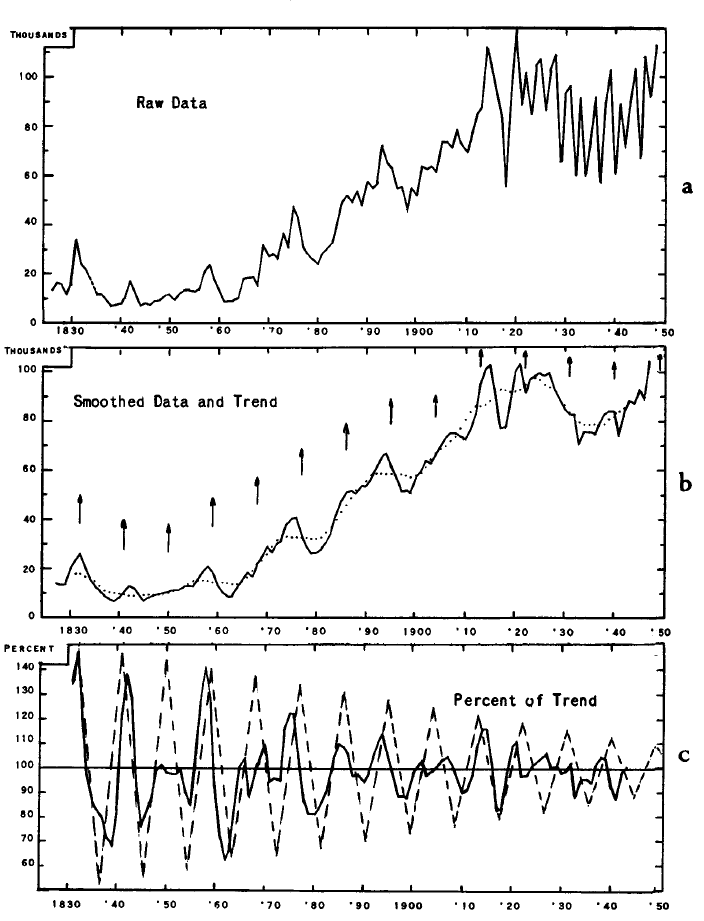
Fig. 8.
Presbyterian Church New Membership, 1826-1948
New membership of the Presbyterian Church in the U.S.A. (northern)
through profession and reaffirmation of faith.
Figure 8a is a chart of the actual new membership in the
Presbyterian church in this country. In 1826 the new membership was
12,938; by 1831 it had climbed to 34,160; then it dipped to 23,546
in 1832, etc.
You've seen hundreds of charts like this: charts of
the stock market, weather charts, perhaps charts of your company's
sales volume. Although you can see some highs and lows that stand
out on the chart, it is fairly difficult to spot any regularity in
the rhythm.
So, like the scientist in his laboratory, we proceed to extract the
impurities and the irregularities in our chart. We do this by means
of a moving average. We take the new membership figures for 1826,
1827, and 1828 and average them.
This average for the three years is
plotted in Figure 8b for the middle year, 1827.
Then we take the
figures for 1827, 1828, and 1829 and average them. This average
figure for three years is plotted on Figure 8b for 1828. We continue
across the years, and now we have a line, the heavy unbroken one in
Figure 8b, that is smoother and that lacks many "impurities."
However, any hints of a regular rhythm are still misty.
Now we refine even further to obtain a trend line. "Trend" is the
general direction in which our series of figures is headed, either
up, or down, or sideways. It smoothes out the violent fluctuations
of yearly new membership simply by taking, in this case, a nine-year
moving average similar to the three-year one we mentioned above. The
dotted line in Figure 8b is our "trend" line.
Now we're getting close to the payoff.
Note that Figure 8c has percentage values, whereas Figures 8a and 8b
indicated the numbers, in thousands, of new memberships. All we do,
in Figure 8c, is plot the percentage that each point of our
three-year moving average (solid line) is above or below the
corresponding value of our dotted trend line in Figure 8b.
One example should clarify this.
New members in 1830, 1831, and 1832
were 15,357, 34,160, and 23,546, respectively - a three-year average
of 24,354.
This is the value that was plotted for 1831, on Figure
8b, as part of our solid line. Note that this figure for 1831
(24,354) is higher than our trend or dotted line for 1831, whose
figure for that year is 17,974. Thus, our three-year moving average,
24,354 in 1831, was 135 percent of our trend, 17,974, and this we
plot for 1831 in Figure 8c.
As we do this for each year, we are
plotting deviation (departure), up or down, from our dotted trend
line, and an apparent cycle begins to take shape before our eyes. To
help you see it I have drawn an exact nine-year cycle in a broken
zigzag line on Figure 8c.
The figures used were adjusted to allow for their change in record
keeping from a fiscal year to a calendar year in 1947.
Figure 9 is similar to Figure 8c, showing a similar nine-year cycle
in new membership of the Congregational churches.
As you can see, when comparing Figure 9 with Figure 8c, the time of
ideal crests for numbers of new Presbyterians and new
Con-gregationalists is identical, although the fluctuations in both
are of much less percentage importance than they once were.
This nine-year cycle, by the way, is nearly directly opposite to the
timing of another cycle of similar length - in bank deposits, cotton
prices, Canadian Pacific Railway ton-miles, and other business
indicators.
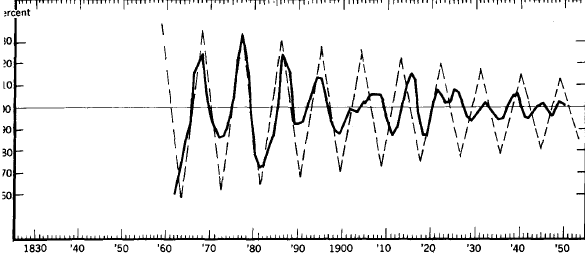
Fig. 9.
Congregational Church New Membership, 1861-1950
New membership of the Congregational Church, smoothed, shown as
amounts above or below trend.
Compare this chart with Figure 8,
which shows similar behavior in Presbyterian Church new membership.
Why is this church-membership rhythm of the
same length as one of the main rhythms in economics, but upside
down? Why do more people join churches in nine-year intervals and
why is this rhythm of less strength than before while the rhythm in
economics continues with vitality?
No one knows, but perhaps these
questions are related to our earlier thoughts. Could there be
something that makes us alternately bold and fearful at intervals of
about nine years?
If so, when we are bold and self-sufficient, might we not be
concerned with business and raise prices by bidding against each
other? And when we are fearful, might we not be more apt to join a
church?
This idea would fit into the decreasing importance of the
nine-year wave in church membership, for everyone knows that over
the past fifty years Protestants have been generally much less
afraid of eternal fire and damnation than were their grandfathers
and great-grandfathers.
Nevertheless, a 1967 Gallup poll indicated that church attendance
increased during 1967 to 45 percent of the adult population. The
last peak year, according to the report, was 1958, when 49 percent
attended during a typical week.
Peak years for our nine-year cycle
in new church membership, according to the average cycle, were 1940,
1949, 1958... and 1967!
The cycle continues.
The Curve of Conscience
Closely related to church membership, or at least to some of the Ten
Commandments preached by most churches, is the matter of mass
conscience, for even here we find a cycle.
One measure of conscience in the mass is provided by the voluntary
guilt offerings made by British taxpayers covering a period of
thirty-two years from 1923 to 1954. Each year the Chancellor of the
Exchequer enters these unexplained and anonymous receipts under the
heading of "Conscience money, remitted by sundry persons for
conscience' sake."
Figure 10 clearly shows a cycle that averages
3i/£ years from peak to peak.
Unfortunately the "curve of conscience" graph depicts the guilt
offerings in money instead of in number of persons making payments.
Otherwise the peaks might be nearer in size to each other, but in
any event, despite the variation of amplitude (a word used
to describe the height or depth of a wave), the regularity of
timing is clearly visible.
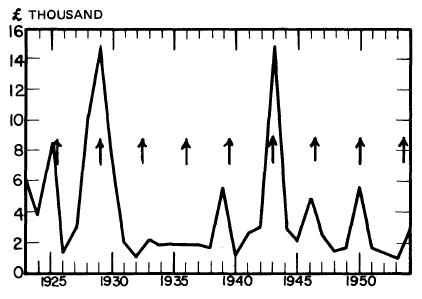
Fig. 10. The Cycle of Guilt, 1923-1954
A 3½-year cycle in "conscience money" or guilt offerings remitted
by British taxpayers,
in thousands of pounds. Arrows are spaced at
3½-year intervals.
Could this regularity be the result of chance? Yes, but with eight
waves as regularly spaced as these it could not easily be the result
of chance.
Do we know that these guilt offerings are really the
result of a 3½-year cycle in the pricks of conscience? Not
necessarily. The payments might be a result of a cycle in the
ability to pay.
Something, however, did cause the behavior, and the
behavior is cyclic.
Marriage, Death, and the Bustle
Two of the most important activities of man in the mass are his
predilection to fight and to speculate. Because both of these
movements affect our lives so greatly, we will deal with them in
separate chapters.
But there are countless other important cycles of mankind, and the
author's problem becomes one of space and selectivity. Which, of
thousands, do I parade before your reviewing stand? Which, of
thousands, do I allow to remain in the Foundation's files for a
second book, and a third?
Variety, I believe, is the ultimate solution. I will select examples
from the widest possible spectrum of our research so that the
universality of rhythmic cycles becomes an acceptable fact of life
to you.
The magic spell of love, so sings the poet, is everywhere. But if
marriage is the ultimate expression of love, then the magic spell
must increase every 18.2 years, for there has been a definite
marriage cycle of this length in our country.
When we studied this phenomenon in 1955, estimates of marriages per
1,000 of population were available from 1867 through 1953. Although
the recent trend in the number of marriages is up, the 18.2-year
cycle is obvious in Figure 11.
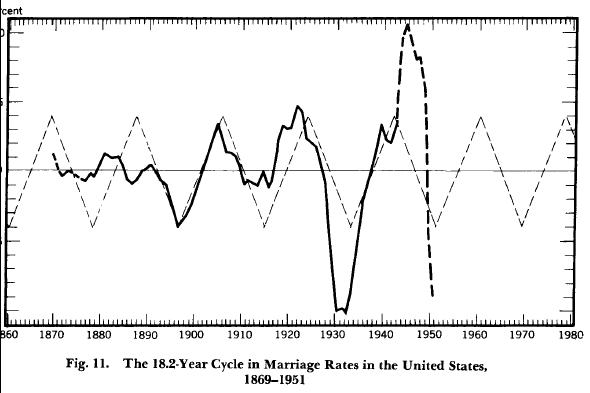
Note: All charts throughout the remainder of this book will show the
cycle under discussion
as amounts above and below trend unless
otherwise specified.
There was a high percentage of
marriages during the years of World War II and immediately after,
but the rhythm corrected itself by 1950. There is no explanation for
this cycle.
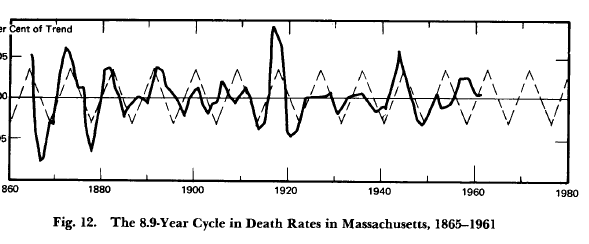
Although our death rate is decreasing at a rate guaranteed to warm
any insurance company's actuarial heart, we apparently die in a
cycle. Data covering the death rate in Massachusetts from 1860
through 1962 have been analyzed.
A cycle of 8.92 years was indicated
(see Figure 12).
From death, we cut through sociological barriers to consider the
shape of women's evening dresses.
Studies by Agnes Brooks Young that
cover the period from 1725 to the present show that three basic
designs, bell-shaped, backsided or bustle, and tubular, tend to
succeed each other at about thirty-five-year intervals and come full
cycle in 105 years.
We are currently in the "bell-shaped" era, but
take heed, for if this cycle continues as it has, we will have to
endure new wifely complaints sometime in the mid 1970's when the
"bustle" returns.
By the way, all girl watchers will be interested to learn that skirt
lengths seem to go up and down in a cycle of one hundred years,
while décolletage has a cycle of its own - it hides and then exposes
in a seventy-one-year rhythm.
While we are on a lighter note, consider eyeglasses. In the 1920's
the squared-off steel frame was fashionable. Then someone developed
a frame slanted upward and outward to two points, called it the
"harlequin," and began to adorn our glasses with everything from
sequins to leopard spots. Now, to be "in," your eyeglass frame must
be plain and unadorned, and even the round glasses of colonial days
are considered chic.
A member of the Foundation once wrote me about the Yo-Yo. He had a
friend in the wholesale toy business who dreaded the advent of the
Yo-Yo fad every few years. When the fad hit, he would find it nearly
impossible to maintain a supply large enough to meet the demand of
retail stores.
Then one morning, with no advance notice, the demand
for Yo-Yos would have evaporated completely.
We don't know why the desire to buy Yo-Yos vanishes over a wide area
at the same time, but I suspect that if we did know, it might throw
some light on the subject of cycles. Buyers of tin tell me that a
similar reversal of attitude in respect to future tin prices
suddenly occurs on the part of a variety of brokers for no apparent
reason.
I have also been told that the popularity of particular
kinds of games, such as Monopoly, recurs at intervals of about
fourteen years.
Perhaps someday we will know why the popularity of
these things fluctuates.
The Tired Masses
Although the United States is a country composed almost entirely of
immigrants and their descendants, immigration has always been a
political football. First we open our gates and the refugees swarm
in. Then we panic and legislate quotas for each country. Then we
relax the quotas, etc., etc.
But in spite of all this tinkering with our immigration laws, the
people of the world still come to us for freedom from poverty,
religious persecution, and oppression - and they do so in a cycle that
has averaged 18.2 years since the early nineteenth century (see
Figure 13) .
Fig. 13.
The 18.2-Year Cycle of Immigration into the United States,
1824-1950
A cycle length of 18.2 years is exactly the same as what we just
mentioned in marriages, and if you compare the two graphs you will
note that they seem to go up and down at the same time.
The same
cycle length of 18.2 or 18.3 years is evident in industrial common
stocks, real-estate activity, wheat acreage, freight traffic on the
Canadian Pacific Railway, lumber and furniture production, floods on
the Nile, tree rings in Java, and many more.
What is it out there
that makes all these unrelated phenomena vibrate with the same
rhythm?
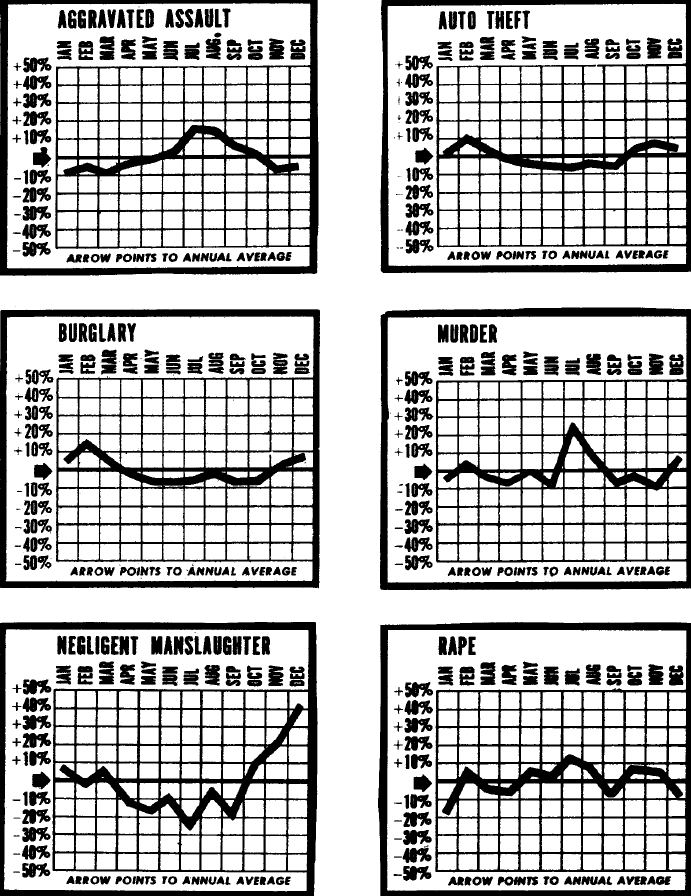
"The Crime of the Month"
Crime, J. Edgar Hoover reported in This Week Magazine some years
ago, has its own cycles, and police records tabulated for five years
from over 2,400 cities and towns show a startling link between
seasonal changes and crime patterns.
Mr. Hoover indicated that
meteorologists, to a limited extent, could predict rapes as well as
hurricanes (see Figure 14).
The pattern of crime has varied very little over a long period of
years. Murder reaches its high during July and August, as do rape
and aggravated assault. Murder, moreover, is more than seasonal;
it's a weekend crime.
It's also a nighttime crime: 62 percent of
murders are committed between 6 P.M. and 6 A.M.
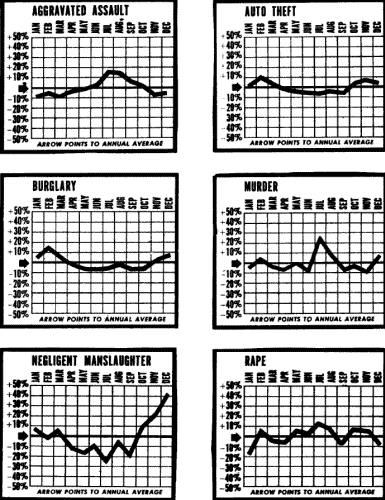
Fig. 14.
Annual Cycles of
Crime (after Hoover)
Unlike the summer high in crimes of bodily harm, burglary has a
different cycle. You are most likely to be robbed between 6 P.M. and
2 A.M. on a Saturday night in December, January, or February.
The most uncriminal month of all? May - except for one strange
statistic. More dog bites are reported in this merry month than any
other month of the year, including the torrid "dog days" of July and
August.
Apparently our intellectual seasonal cycles are completely different
from our criminal tendencies. Professor Huntington, until his death
a valued board member of the Foundation for the Study of Cycles,
made extensive studies to discover the seasons when people read
serious books, attend scientific meetings, make the highest scores
on examinations, and file the most amendments to patents. In all
instances he found a spring peak and an autumn peak separated by a
summer low.
Conversely, Professor Huntington's studies indicated that June is
the peak month for suicides and admissions to mental hospitals. (It
is also the peak month for marriages, although I leave any possible
correlation to someone braver than I.)
Possibly, soaring thermometers and stifling humidity are the
catalysts that bring on our strange and terrifying summer actions,
but J. Edgar Hoover is not sure. He says,
"There is, of course, no
proof of a correlation between humidity and homicide. Why murder's
high tide should come in summertime we frankly don't know."
Heart Disease and Two Old Friends
In 1900, 20 percent of the total deaths in the United States were
due to cardiovascular-renal diseases.
Today, over 50 percent of our
deaths are ascribed to heart disease. Of course, this proportion
grows larger as we discover cures for many diseases that killed us
fifty or sixty years ago, for it is fact that our overall death rate
continues to decline nearly every year.
Strangely enough, deaths
from heart disease, at least in the northeastern United States, have
had a cycle of 9⅔ years, and this cycle becomes somewhat
frightening when it is placed on the same graph with the rise and
fall in population of our old friends, the Canadian lynx and the New
Brunswick salmon (see Figure 15).
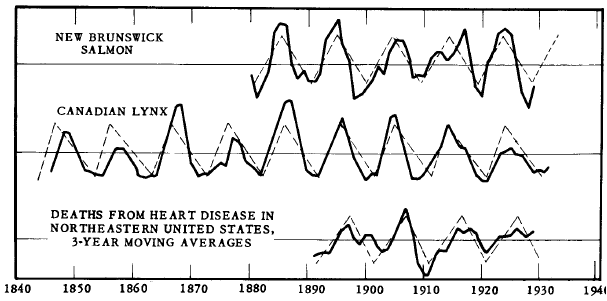
Fig. 15.
Is This a Clue to Our Mystery?
A similar 9.6-year cycle is evident in the abundance of Atlantic
salmon, Canadian lynx,
and human deaths from heart disease in
northeastern United States (after Huntington).
What relationship could there possibly be between the cessation of
our heartbeats and the abundance of lynx and salmon?
Who can link
these three events with reason and logic? Common sense disappears in
the attempt.
And yet, like the apple that fell at Newton's feet, the
hint we see in Figure 15 is an invitation we cannot resist to carry
our small light of inquiry deeper into nature's dark corners.
Back to Contents
|