|
"What can be more foolish than to think that all this rare fabric of
heaven and earth could come by chance, when all the skill of art is
not able to make an oyster."
- Jeremy Taylor
7. The Rhythm of Production
Several years ago the distinguished author Jim Bishop, in a Playboy
interview, called attention to the number of coincidences in the
lives and deaths of Abraham Lincoln and John F. Kennedy.
At 7:30 A.M. on Friday, November 22, 1963, five hours before he was
shot in the back of the head, Mr. Kennedy told Kenneth O'Donnell,
his appointments secretary, that anyone who wanted to exchange his
life for the life of the President could do it.
At 4:30 P.M.,
Friday, April 14, 1865, five hours and forty-five minutes before he
too was shot in the back of the head, Mr. Lincoln said to his
bodyguard, Major Crook, in reference to a possible assassination,
"I
know of no one who could do it and escape alive. But if it is to be
done, it is impossible to prevent it."
In each case, as Bishop noted, death came on Friday; the assassin
was a political malcontent; the wound was in the back of the head;
the President's wife was at his side when it happened; and the
President was succeeded by a southerner named Johnson.
Lincoln and Kennedy were both elected President exactly fourteen
years after having been elected to Congress; Booth shot Lincoln in a
theater and Oswald was captured in a theater. Both assassins were
shot to death before coming to trial. When Lincoln was buried, his
son Robert moved to 3014 N. Street in Georgetown. When Kennedy was
buried, his son John lived at 3014 N....
Missing pages 76 to 78...
...economic affairs, we touch a nerve that initiates unusual reaction
and definite rejection from a large group, especially economists.
One of this group, who was chief economist for one of our large
corporations, stated the case for his fellow economists when he
said,
"If what you say is true, then all I have ever learned about
economics is wrong, and my life's work is tumbled like a house of
cards. I simply cannot afford to accept anything of the sort."
This gentleman also taught our young at one of our large
universities. Perhaps his attitude is a microcosm of university
teaching attitudes in general, a fact that our youth has been trying
desperately to call to our attention.
I remember another remark from one company's executive
vice-president.
"I believe you really have something," he said, "but
I wouldn't want my people to know I took stock in anything like this
or I'd never hear the end of it."
I was reminded of this gentleman's comments one evening when I read
a thirteenth-century commentary about the compass in A Short History
of Science by Sedgwick, Tyler, and Bigelow:
"No master mariner dares
to use it lest he should be suspected of being a magician; nor would
the sailors venture to go to sea under the command of a man using an
instrument which so much appeared to be under the influence of the
powers below."
Cycles, in spite of those who have buried their heads in sand, do
exist in economic affairs, and because of our country's
concentration and worship of material things there are more
statistics and data available to us in economics than in nearly
any other area of study, although this is a small part of the whole
field of cycles.
Let me proceed by showing you a representative sampling of cycles in
the physical production of goods and services. These have been
selected from the Foundation's monthly magazine, Cycles, which since
1950 has kept its members abreast of possible cycles in hundreds of
phenomena ranging from war to the price of eggs.
My presentation may be somewhat unusual. Ten physical-production
cycles from various industries will be shown, but only as they
appeared when they were published originally in Cycles.
The graphs
presented for your consideration are the graphs that accompanied
each original article, some extending back to the early 1950's. No
attempt has been made to bring these graphs and their cycles up to
date. In most cases we had placed the cycle "on the table" for our
members and then went on to other probings.
My comments on each
cycle will be excerpts from my comments accompanying the original
article, for to include the full articles would fill nearly half
this book.
Before we begin, let me anticipate one tantalizing thought that may
have occurred to you. Am I not doing exactly what I gently chided
Jim Bishop for doing in his Kennedy-Lincoln coincidences? By showing
you just ten cycles in physical production, am I not marshaling
those rhythms that will best prove my case while ignoring those that
will not? No - for two reasons.
First, each cycle by itself presents evidence of rhythm that usually
goes well beyond the area of mere chance, as you will see for
yourself. Second, the ten cycles you will see represent only a
microscopic portion of the cycles and alleged cycles from the
Foundation's files at Pittsburgh.
These few were selected because
each has characteristics unique to itself, and they have been
limited to ten so that our point can be made quickly and
effectively. Many others will be placed "on the table" for your
inspection as our investigation continues.
Now, as the auditors say, let's check the files.
The Six-Year Cycle in Orders Received by General Electric
Cycles, September 1950
"For more than 50 years the orders received
by the General Electric Company have fluctuated in a rhythm of about
6 years in length [see Figure 16]. Through wars and depressions, in
spite of changes in management and changes in the nature of the
business, the rhythm has persisted.
"...This rhythm has consisted of ten waves, clearly visible in
the raw or unmanipulated figures.
"...A rhythm of this length is very common in American industry. Of
thirty companies studied it is present in the sales and production
of twenty-five. A rhythm of similar length is present, on the
average, in each of six 100-year sections of tree-ring measurements;
it has been alleged to be present in the alternate thickness and
thinness of rock strata; it is present in barometric pressure in New
York City and it is clearly present in sunspots with alternate
cycles reversed.
". . . This rhythm is significant
because of the number and regularity of the waves. If it
continues as in the past 57 years it is something well worth
taking into account in trying to predict the future, not only of
the General Electric Company, but of the country as a whole."
The 5½ -Year Cycle in Airplane Traffic
Cycles, December 1950,
"Mr. Albert J. Kapteyn of East Hartford,
Connecticut, a former airlines engineer at Pratt and Whitney, has
called my attention to a 5i/£-year cycle in airplane traffic in the
United States" [see Figure 17].
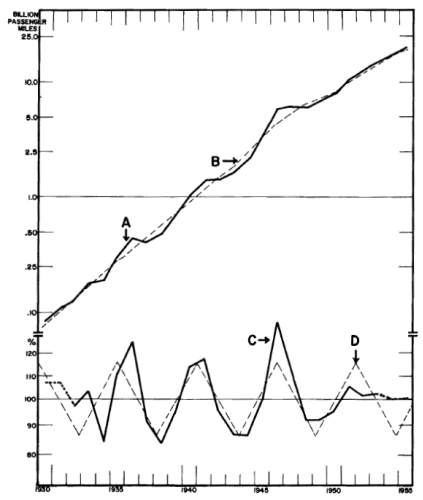
Fig. 17.
The 5½-Year Cycle in Airplane Traffic, 1930-1955
Upper portion shows growth (solid line) and trend (broken line).
Lower portion shows amounts above or below trend and an obvious
cycle approximately 5½ years in length.
With so few repetitions
there is no assurance that the cycle will continue;
however, it
cannot be ignored since a cycle of similar length has been
discovered in many other phenomena.
Street in Georgetown. Both widows declined with thanks all
invitations to the White House. Both widows could speak French.
Bishop also pointed out many more correspondences of a general
nature such as courage, concern for the rights of the Negro, and
such personal characteristics as wit.
He says,
"The parallels
between the 16th President and the 35th run deep, beyond the
credibility of the word coincidence."
His implication was obvious.
The coincidences he had discovered, in
his opinion, were more than mere coincidences. They had special
significance or meaning.
If Jim Bishop is correct, the significance he implies is occult or
mystical. It is neither statistical nor scientific.
What is the difference?
First of all, there is nothing wrong with coincidence from the
scientific point of view. If you combine two parts of hydrogen and
one part of oxygen, you get water. If you try this experiment again,
you get the same result, a coincidence. A third try and you get
water again, a second coincidence. After a sufficient number of
coincidences, science will accept this behavior as the way things
act.
What then are the differences between the coincidences that Bishop
spoke of and those accepted by science?
Basically there are two.
-
First, science will accept as meaningful those coincidences that
will enable you to predict. You can predict with complete accuracy
that when you mix two parts of hydrogen with one part of oxygen you
will get water.
-
Second, science will accept as meaningful those
coincidences that will lend themselves to statistical evaluation.
Bishop's coincidences do not enable you to predict.
The fact that
Lincoln and Kennedy were both followed by men of the same name did
not enable us to say that Lyndon Johnson would be followed by a man
named Grant. The fact, if it is a fact, that Eliza McCardle Johnson
could speak German did not enable us to predict that Lady Bird
Johnson would have this same skill.
The fact that both Lincoln and
Kennedy were shot between five and six hours after speaking of the
ever-present possibility of assassination does not enable us to
predict that any future President might experience a similar fate
should he make a similar remark.
Nor can Bishop's coincidences be evaluated statistically, which, in
fairness to him, was probably not his intent anyway. For to evaluate
something statistically you need to know the number of non-coincidences as well as the coincidences so that you can compare
one with the other.
For example, using imaginary facts, it may be that Kennedy had three
buttons on his jacket while Lincoln had four; that Kennedy had eggs
and bacon for breakfast, Lincoln, oatmeal; and that, on the morning
of the fateful day, Kennedy showered while Lincoln merely sponged.
The point is that out of millions and millions of facts, known and
unknown, the investigator selected only those that fitted into the
picture he wanted to paint. We do not know how many instances
existed where there was no correspondence between the two
Presidents. Without such knowledge, statistical and scientific
evaluation is impossible.
Now let us apply all of this to cycles.
We too deal with coincidences, but they are of the scientific kind,
not the mystical or occult. They are scientific simply because they
can be used as a basis for prediction and because they can be
evaluated statistically. When cycles have repeated enough times with
enough dominance and enough regularity we have a firm basis for
making predictions.
A young man once asked his father,
"How do we know the sun will come
up tomorrow?"
His father answered,
"Because it always has!"
How different this is from Bishop's coincidences.
If the young man's question had been slightly different, if he had
asked,
"How do we know the sun will shine at noon tomorrow?"
The
father, mindful of eclipses, might have answered that it probably
would because it almost always did.
Prior to the sixth century B.C.,
that is as far as he could have gone in his prediction. However,
after the Babylonians learned to predict eclipses, he could have
answered with assurance, one way or the other.
In modern economic-cycle study, which we will begin to deal with in
this chapter, we are about where the astronomers were before the
Babylonians. We know about the cycles but we don't know, in advance,
with certainty, when they are going to come early or late. Like the
evening grosbeak on his biannual return to New England, we're not
even sure if the cycle will appear at all every time that it is due.
To know all this, in advance, is the next great step forward.
The second difference between our coincidences and Bishop's (our
ability to predict, although admittedly only partially, being the
first difference) is that we know, or can learn, all the
coincidences that are not present in a series of figures we are
examining, as well as those coincidences that are present. Thus we
can measure the significance of the coincidences that interest us.
If every single fact of Kennedy's life, Lincoln's life, your life,
my life, and a score of other lives could be recorded, there would
doubtless be many coincidences shared by Kennedy with each of us.
From the scientific point of view the question then would be, are
the coincidences shared by Kennedy with Lincoln more numerous than
the coincidences shared by Kennedy with any of the rest of us, or by
each of us with each other? If so, are they more numerous enough to
mean anything?
Obviously a comparison of this sort cannot be made in this case, but
it is possible to do so in cycle study.
To oversimplify the matter,
you can find the best cycle (succession of coincidences?) in a real
series of figures, for example, sugar prices. You can then randomize
these figures, scramble them again and again, and look for the best
cycle in each new series of figures you obtain.
This will enable you
to count how many scrambles it takes you to obtain, by chance alone,
a cycle as good as the one you had discovered in the actual sugar
prices with which you began. If it takes a hundred tries, you will
know that your original sugar-price cycle could not be the result of
a chance arrangement of the figures more often than once in a
hundred times.
Thus it is a fairly strong assumption that the cycle
you found in sugar prices is meaningful.
The Mysterious Pendulum of Production
It is fairly easy to accept the notion of cycles in plants, animals,
and even human beings, for many of these are well known and accepted
by biologists and physicians.
But when it comes to the matter of meaningful cycles in
Missing pages 79 to 83
"Airplane traffic is measured in billions of passenger miles.
Figures are available from 1930 and are plotted as Curve A [remember
all lines on graphs are called "curves" even if they are absolutely
straight]... The tendency for growth to be more rapid at
intervals of about 5l/£ years is evident by inspection.
"Curve B shows a 5-year geometric moving average trend of Curve A.
The two values at each end are estimated. Curve C shows percentages
above and below trend. Curve D is how a perfect 5i/£-year cycle (a
periodicity) would look.
"...With a series as short as this we have had time for only
about five repetitions of this cycle, not many on which to base
judgment in regard to its significance. However, a 5i/£-year cycle
is well established in other things. It was discovered in corn
prices in 1875 and has been coming true ever since and cycles of
about this length have also been found in European weather, cotton
prices, pig iron prices, sunspot numbers, and the sales of at least
two manufacturing companies.
"...By adjusting for the effect of this 5i^-year cycle we can get
a more accurate estimate of the fundamental underlying growth trend
than we can get in any other way."
The 6.4-Year Cycle in Aluminum Production
Cycles, January 1963 - "The Foundation for the Study of Cycles has
uncovered a 6.4-year rhythmic cycle in aluminum production [see
Figure 18]...
This rhythm has repeated twelve times during the
78 years that we, in the United States, have been producing
aluminum. It characterizes and dominates the variations of this
activity.
"...Growth is a characteristic of this industry. From 1885, when
we produced less than 500 pounds, to 1962, production has increased
eight million fold! Our interest in growth is because growth is the
underlying structure around which the cycles oscillate. But our
concern is primarily with the cycles.
"...The fluctuations recur with regularity [as you can see in
Figure 18]. That is, they tend to conform to a perfectly regular
pattern that can be fitted to them... in this instance, an ideal
pattern that repeats regularly every 6.4 years.
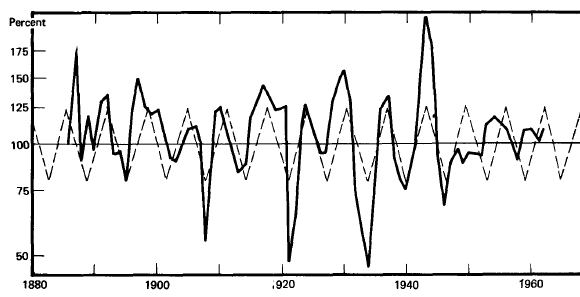
Fig. 18.
The 6.4-Year Rhythm in Aluminum Production, 1885-1962
"A great many other things besides aluminum production are
alleged to have rhythmic cycles of about 6.4 years in length. In the
economic field we have a cycle of about this length in the liability
of commercial and industrial failures, in the unit sales of General
Motors passenger cars and trucks, in pig iron prices, in cotton
prices, in rail stock prices.
"Are these cycles all one and the same? Only very accurate
measurements will tell. If they are the same, is this mere
happenstance, or is there some relationship?
"...At all events, with this strong and important rhythm in
aluminum production, we have one more example of the almost
universal presence of rhythm in the world around us."
The 18⅓ -Year Cycle in Real-Estate Activity
Cycles, February 1959,
"Real estate activity in the United States
has fluctuated since 1795 in a very regular cycle slightly over 18
years long.
Whether the real estate people realize it or not, this
cycle has been the basic fact of life in the real estate business.
The graph [Figure 19] shows an ideal 18i^-year cycle by means of a
broken line and compares it to the actual Index of Real Estate."
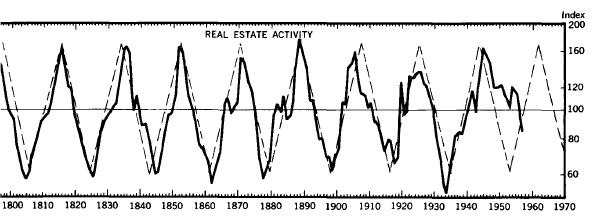
Fig. 19.
The 18 1/3-Year Cycle in Real-Estate Activity, 1795-1958
Data are for January of each year.
Activity. The Index is expressed as a percent of normal with the
'normal' level of real estate activity as a horizontal line at 100
and the fluctuations shown above and below this line.
This
information is from Roy Wenzlick & Company who publish it regularly
in The Real Estate Trends.
"...From 1795 through 1946 there were eight repetitions of the
18i/^-year cycle. The experience covers a time span of 150 years and
the waves are too clear and regular to be denied or ignored.
However, in view of the current picture, this cycle should be
reviewed yearly and should not be relied upon until it is again
clearly on the track."
The Eight-Year Cycle in Cigarette Production
Cycles, April 1962,
"From 1879 through 1958, cigarette production in
the United States has been characterized by a rhythmic cycle with a
wave length very close to 8 years in length [see Figure 20].

Fig. 20.
The 8-Year Cycle in Cigarette Production, 1879-1958
According to the test of significance developed by J. Bartels, this
behavior could not be the result of chance more than 3 times out of
100. [Bartels, a German mathematician, developed a method of
computing the odds of any cycle occurring by chance.]
"In the actual data, this rhythm has usually expressed itself in
changes in the rate of growth. Growth is first rapid, then less
rapid. The reason for this rhythmic behavior is unknown.
"...8-year rhythms are present in many other phenomena and these
other 8-year cycles tend to crest at more or less the same time.
Could there be a common cause for some of these various behaviors?"
The Six-Year Cycle in Steel Production
Cycles, June-July 1955,
"The production of steel ingots and castings
from 1874 through 1947 has been characterized by a 6-year rhythm
[see Figure 21]. This rhythm has repeated enough times and with
enough regularity so that it cannot be the result of random forces.
". . . Steel production is rather complex and the 6-year cycle is
only one of many tendencies. Note that the 6-year cycle tends to
fade out in the period 1890-1905. It looks as if it might be
starting to fade out, again. If so, we can expect, based on the
1890-1905 precedent, about three rather poor 6-year cycles after
which the 6-year cycle can be expected to reassert itself.
"A cycle which gradually fades out and then reappears can be the
result of the influences of another cycle, slightly longer or
slightly shorter than the cycle which fades. I suspect that such a
cycle is present in steel production. I shall investigate it and
tell you more about it in another article. I shall also tell you
about other cycles present in this series of figures. You need to
know about several cycles before you are in a position to do any
forecasting."

Fig. 21.
The 6-Year Cycle in Steel Production, 1874-1947 (Randoms
Removed)
The Thirty-Three-Month Cycle in Residential Building Construction
Cycles, August 1956,
"The 33-month cycle in residential building
construction has continued for six and a half cycles since it was
discovered by Cornell economists over 17 years ago.
"The chart [Figure 22] is in two sections. The left section is taken
from Farm Economics of February, 1939. The right section is based on
the F. W. Dodge Corporation's valuation of residential building
construction contracts awarded in 37 states and has been drawn with
a heavy line to indicate that the behavior unfolded after the
discovery of the cycle.
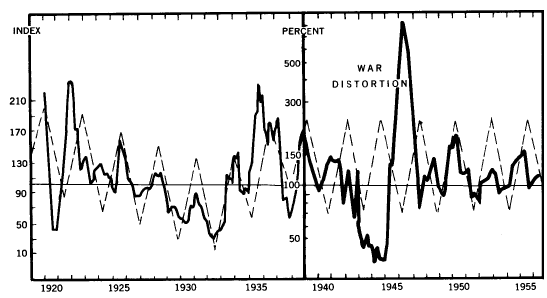
Fig. 22.
The 33-Month
Cycle in Residential Building Construction, 1920-1955
Solid line indicates percentage up or down from the same month
of the previous year.
"...Note the major distortion during the war period and the
gradual return to normal after the war's close... picking up the
old rhythm again. Why?"
Solid line indicates percentage up or down from the same month of
the previous year.
"The 33-month cycle is one of the best substantiated cycles in our
files. There is no doubt in my mind as to its significance."
The 9.6-Year Cycle in Wheat Acreage
Cycles, May 1951,
"We are happy to announce the discovery of a cycle
of about 9.6 years in length which has been present in the acreage
of wheat in the United States from the earliest figures, 1868, to
the present [see Figure 23]. The recurrence of this cycle over the
span of 85 years, and the strength and regularity displayed, made
this cycle an important factor for agriculturalists involved in our
great multi-million dollar wheat industry.
"As nearly as I can determine in a series of this length and
regularity, the length of this cycle is 9.6 years. [Remember the
Canadian lynx, and the salmon... and the deaths from heart
disease?]
"The pattern was badly distorted just prior to and during World War
I, but with World War II there was no distortion."

Fig. 23.
The 9.6-Year Cycle in Wheat Acreage Harvested, 1868-1947
The 9.03-Year Cycle in Insurance Sales
Cycles, March 1967,
"Ordinary life insurance sales have risen
consistently, year-by-year, since 1949. In 1965 sales totalled over
$89 billion. [Since any professional insurance man refers to his
sales as his "production," we bow to his categorization and include
insurance sales in our sampling of cycles in economic production.]
"A statistically significant 9.03-year cycle has been present in the
sales record of ordinary life insurance since 1858, the first year
of record [see Figure 24]. This cycle is not only statistically
significant, which makes it important to cycle study, it is also
prominent enough to exert an important effect on insurance sales
which makes it important to the insurance industry."
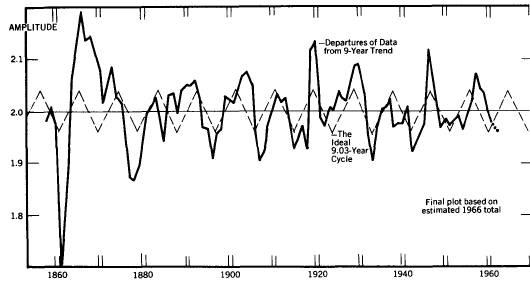
Fig. 24.
The 9-Year Cycle in Life-insurance Sales, 1858-1962
The 9.18-Month Cycle in Ton-Miles of the Canadian Pacific Railway
The Canadian Pacific Railway cycle was first announced in Cycles in
a long article in its June 1951 edition. Rather than include many
excerpts I will tell you the story, briefly.
Mr. G. Meredith Rountree was the Canadian Pacific Railway's chief
statistician in the 1940's. In 1942 his company dispatched him to
the Foundation for the Study of Cycles to make a study of the
rhythmic fluctuations that might be present in their business. He
worked at Foundation headquarters for approximately one year and his
findings are a milestone in cycle research.
His work involved ton-miles, the number of tons of freight carried
multiplied by the number of miles each ton is hauled. Like most
railroads, the Canadian Pacific's freight business was somewhat
seasonal. Mr. Rountree first removed the distortion of this seasonal
business from his monthly figures, which were available back to
1903.
The remaining data produced an unbelievable cycle that marched
across his graph paper with forty-nine repetitions averaging 9.18
months per cycle (see Figure 25).
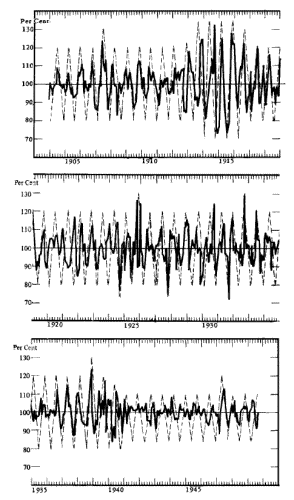
Fig. 25.
The 9.18-Month Cycle in Ton-Miles, Canadian Pacific
Railway,
1903-1948
This rhythm continued through
World War I, stumbled twice between 1920 and 1925, picked up the
cadence again until 1934, stumbled again, then corrected its step,
and marched right up to World War II.
During World War II the cycle almost vanished, in contrast to World
War I, but after the war it reasserted itself on the same time
schedule, same wavelength, and same calendar timing as before the
war!
One cannot conceive of finding a pattern as regular as this,
repeating so many times, in random numbers.
Back to Contents
|


