|
by Cap Allon
February 07,
2020
from
Electroverse Website
Outspoken Ph.D. Physical Scientist Ned Nikolov has recently
raised an important question: can we trust NOAA's Mauna Loa CO2
readings (aka the
Keeling Curve)?
The pre-industrial CO2 level of ~280 ppm - the starting
point of many 'alarmist charts' - comes from ice cores which do not
preserve the high-frequency elevated CO2 values that
existed in the atmosphere at the time, explains Nikolov.
However, when using
chemical methods to obtain direct atmospheric measurements, it is
revealed that
CO2
levels have, in the past, always closely followed
global temperature anomalies (with a few years lag).
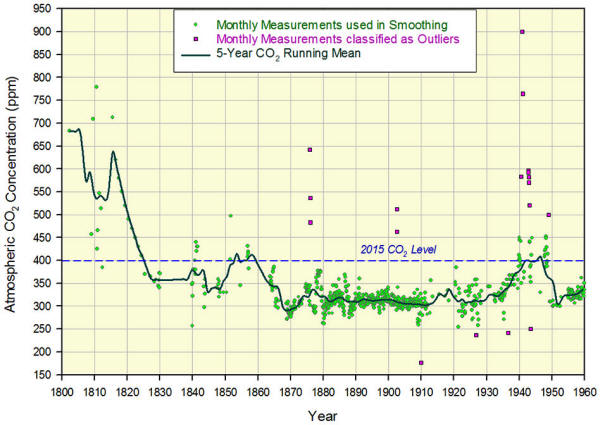
Using this method, it has
been revealed that CO2 levels climbed above 400 ppm in
the 1940s (a period succeeding the very hot "Dust
Bowl" 30s):
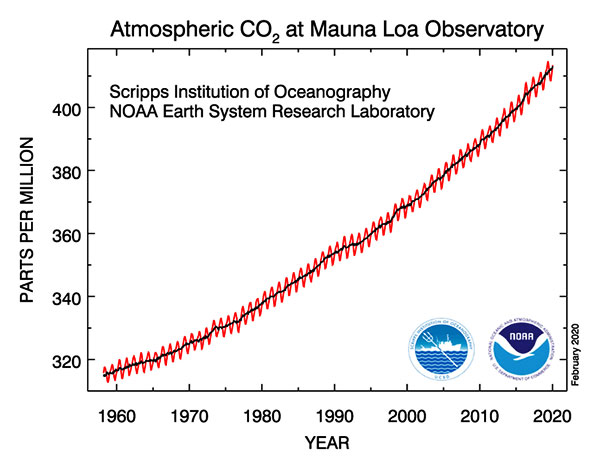
Compare this to
the NOAA's atmospheric CO2
chart (below) - with its suspiciously clean, simple, and linear
trajectory for 60-odd years - and it could well be the case that
Nikolov is onto something:
that
the Mauna Loa observations are
flawed, contrived, or even "heavily doctored"...
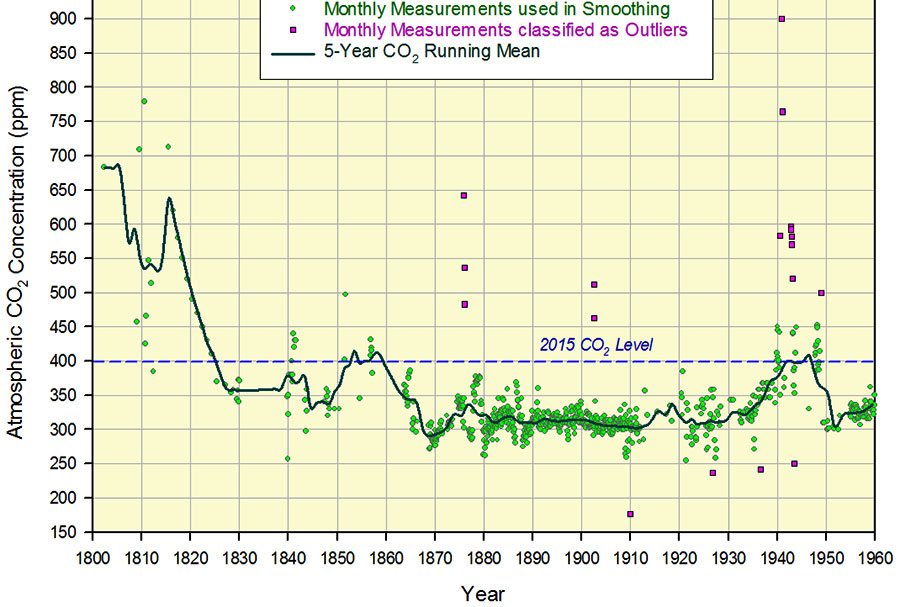
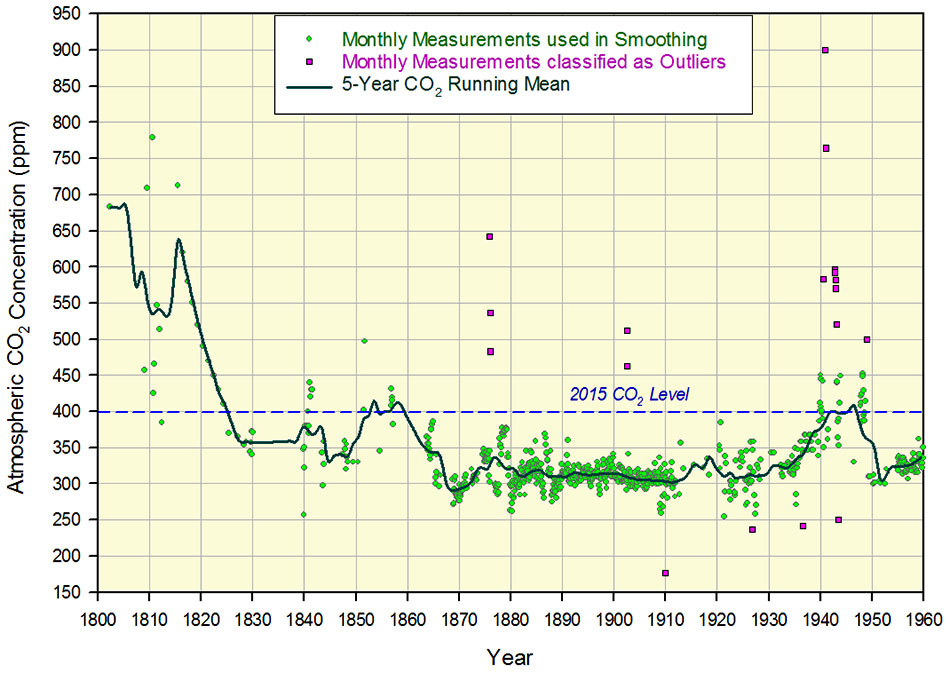
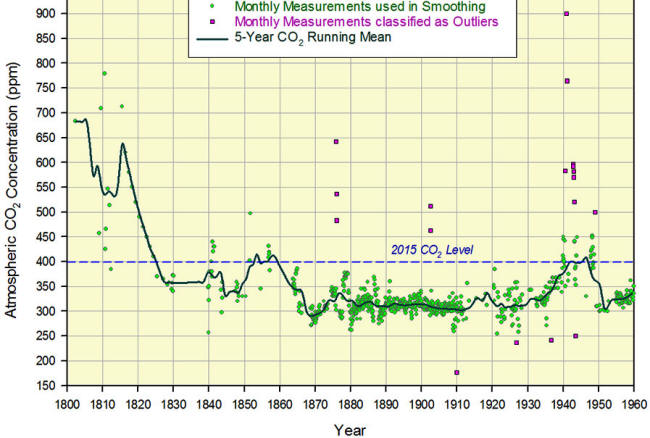
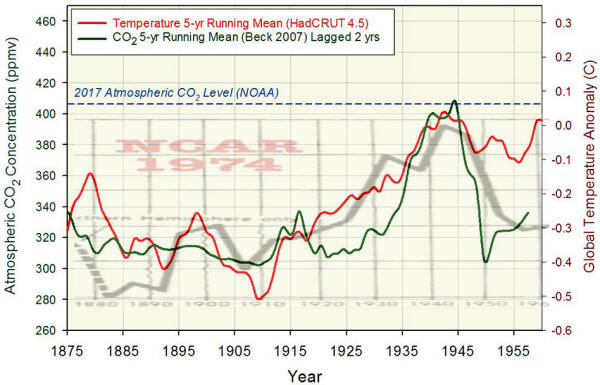
The smoothed Beck (2007) CO2 dataset (shown below) is
based on roughly 90,000 direct atmospheric measurements using
chemical methods, many of them made by Nobel Prize laureates, writes
Nikolov.
The set closely follows global temperature anomalies of the
HadCRUT4 dataset for 85 years with
an average lag of around 2 years.
Also important to note,
Beck's data are completely independent of the HadCRUT4 temperature
record.
Beck E-G (2007) 180 Years
of atmospheric CO2 gas analysis
by chemical methods.
NOAA's atmospheric CO2 record (shown below) is based on
direct air measurements at Mauna Loa HI using infrared
spectroscopy.
NOAA ESRL states:
"We have confidence
that the CO2 measurements made at the Mauna Loa
Observatory reflect the 'truth' about our global atmosphere."
However, this CO2
record does NOT follow global temperature anomalies of the HADCRUT4
dataset, as Beck's record does.
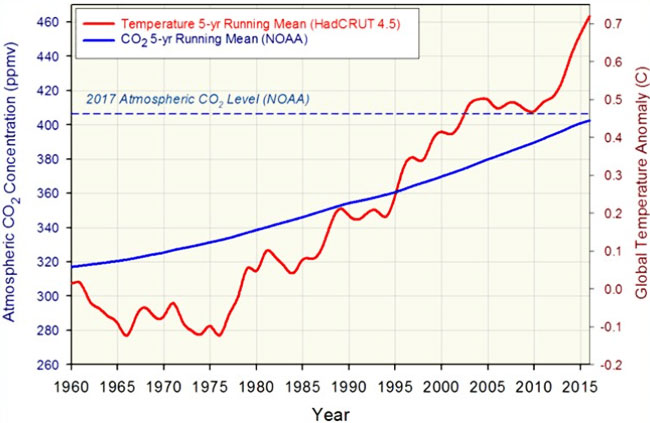
https://esrl.noaa.gov/gmd/ccgg/trends/data.html
This is something that Nikolov finds highly questionable, writing:
"the Keeling CO2
curve has some synthetic features that suggest it might have
been contrived or heavily doctored.
No real-world
measurements of a parameter would follow such a clean, simple,
and straight trajectory for 60 years."
Does this serve as yet
more evidence of NOAA 'book cooking'...?
|