|

by Mike Adams
the Health Ranger
April 20, 2011
from
NaturalNews Website
Thanks to the Fukushima catastrophe, we've all been learning a lot
about the laws of physics lately - especially about radiation. To
help explain it all, the folks over at
InformationIsBeautiful.net
have created a radiation explanation chart that shows the relative
levels of harm from various doses of radiation.
The InformationIsBeautiful website is pretty cool. The folks there
specialize in making complex data visually interesting. I've admired
some of their work for quite some time.
So I was checking out their new "Radiation Dosage Chart" which
explained all the effects of receiving radiation doses of various
levels.
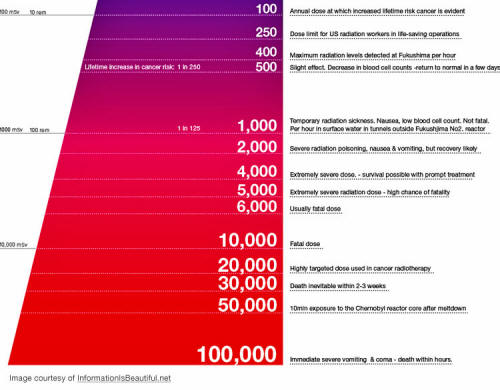
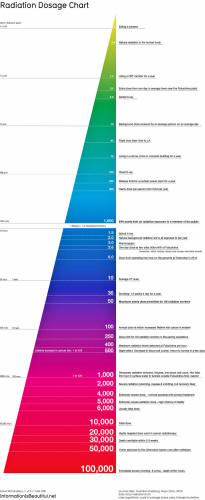
The chart revealed things like:
-
100
mSv Annual
dose at which increased lifetime cancer risk if evident
-
250 mSv Dose
limit for US radiation workers in life-saving operations
-
1,000 mSv
Temporary radiation sickness. Nausea, low blood count. Not
fatal, and so on...
As I read down the chart, things got really interesting.
View the
chart yourself here:
-
2,000 mSv Severe
radiation poisoning
-
4,000 mSv
Extremely severe dose - survival possible
-
5,000 mSv
Extremely severe radiation dose - high chance of fatality
-
6,000 mSv
Usually fatal dose
-
10,000 mSv Fatal
dose
And then, right there on
the chart, the very next line was a huge eye-opener, because it
said:
Cancer
radiotherapy dose is fatal?
Okay, so wait a minute. A dose of 10,000 is fatal, yet the cancer
industry uses twice that dose to "treat" cancer? I knew cancer
radiation treatments were barbaric, but I never knew they were
twice
the amount considered absolutely fatal.
This outcome was so intriguing that I took a screen capture of the
chart. That's what you're
seeing at above image.
The next day, I went
back to the InformationIsBeautiful.net website to make sure I really
saw what I thought I saw.
After all, if cancer radiotherapy is being
given at 20,000 mSv, that's a pretty big story, especially in light
of the Fukushima fallout and the increasing radiation burden on
populations everywhere.
So I brought up the website, and guess what?
The 20,000 mSv cancer radiotherapy line had been removed from the
chart.
You can now see this for yourself at the InformationIsBeautiful
website:
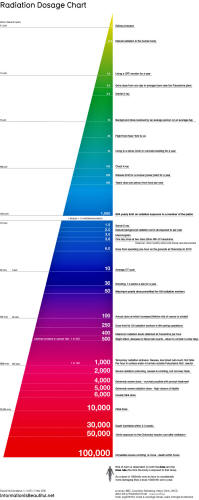
Notice anything missing?
The 20,000 mSv line has been removed. It now jumps from 10,000 to
30,000.
Jokingly stated, it seems that the Information Is Beautiful website
might now appear to be the Information Is Missing website.
Cancer
industry influence?
So how do you think this line about 20,000 mSv in cancer
radiotherapy got removed? I suppose there are a number of possible
explanations for it.
One particularly
conspiratorial explanation is that someone from the cancer industry
probably asked them to remove it. The cancer industry, after all,
doesn't want people knowing the simple truth that cancer
radiotherapy involves a fatal dose of radiation. And no industry
operates with more secrecy than the cancer industry, it seems, with
all its cover-ups about the dangers of chemotherapy and its
continued suppression of the truth about
vitamin D and its cancer
preventive effects.
Then again, the InformationIsBeautiful website has actually done a
fantastic job of producing information about Vitamin D and sunlight
exposure.
This is precisely the kind of information the cancer
industry doesn't want people to see:
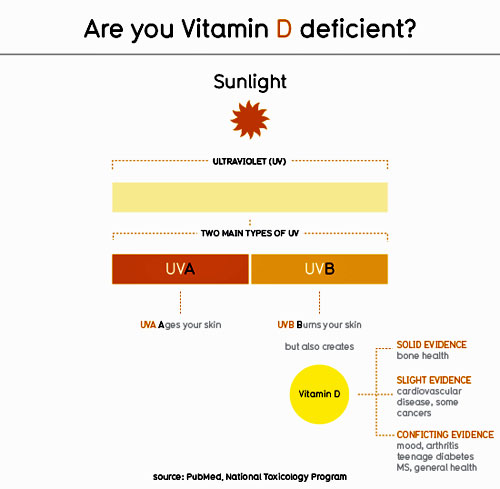
(Pretty cool chart, eh?
- click above image)
Just to give these folks a chance to explain all this, I sent off an
email to David at the InformationIsBeautiful website asking them to
clarify why they pulled the cancer radiotherapy information off
their radiation dosage chart. Perhaps there's a completely innocent
explanation for it, I thought, and I want to know the real story
here.
The email I received in return was a polite response with a
collection of frequently asked questions and answers.
I don't blame the guys
there for using this - they're probably incredibly busy these days -
but I was intrigued by one of the answers in the email itself: It
said that the InformationIsBeautiful team has,
"done commercial
work for GE, the BBC, Google and many others."
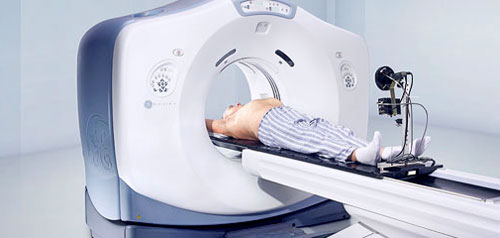
And who is
GE? They are,
of course, one of the world's top manufacturers of radiotherapy
equipment!
You can see an example of their radiotherapy machines below:
So now we have the
Information Is Beautiful team pulling the "cancer radiotherapy" line
out of their chart, then admitting they are a paid client of General
Electric, a top manufacturer of radiotherapy equipment.
None of this proves anything, of course, but it probably raises a
few eyebrows.
Is there a financial conflict of interest at work
here? Personally, I like their website a lot, and I'm a fan of their
charts. So I don't want to think they might be engaged in some sort
of intentional censoring of their chart data just to protect the
cancer industry.
But I've seen stranger stuff happen, for sure...
Is this a case
of blatant information distortion?
The Information Is Beautiful website, by the way, isn't necessarily
known for censoring their information due to political pressure.
They do seem to be good
guys in plenty of ways. For example, they say they're donating the
proceeds from the sales of their radiation dosage chart to help with
Japan relief efforts, and that's admirable. They also produce a lot
of other really useful charts that have been very popular across the
'net.
Then again, the cancer industry can be very, very threatening to
those who don't submit to its suppression of information both on the
web and across the mainstream media.
Now, the trolls and paid online muckrakers hired by
Big Pharma will
of course insist that I'm making all this up. They'll say the chart
never had the 20,000 line in it. I must have Photoshopped my
screenshot to put it there, they'll charge.
These people never stop
lying in their attempts to smear those who are working each day to
expose the deceptions of the pharmaceutical industry, of course.
(They are actually paid by Big Pharma to poison the 'net.)
Fortunately for me, there is yet another source of evidence that
backs up my story. A thread over at
Gizmodo.com contains the exact
same original radiation dosage chart that captured as a screen shot.
It shows quite clearly the original 20,000 mSv line.
See it below:
The Most Colorful, Readable
Radiation Dosage Chart Yet
http://gizmodo.com/#!5786933/the-most-colorful-readable-radiation-dosage-chart-yet
I am taking a screen shot of that page
(above image), too, just in case it
magically disappears. If you go there and don't see the chart, rest
assured that's exactly what happened (I've seen this happen hundreds
of times with sensitive topics).
The chart image on that page links to an archived image on
Gawkerassets.com which contains the full chart:

http://cache.gawkerassets.com/assets/images/4/2011/03/radiation_chart_01.png
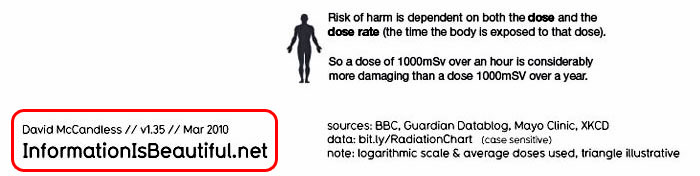
And there, for all the world to see, is the full chart, with the
20,000 mSv "cancer radiotherapy" line, credited to David McCandless,
March 2010,
InformationIsBeautiful.net
Now, just in case that image also gets squelched off the 'net, I
have saved a copy of it as well.
Version 1.35
has less information than version 1.0
Interestingly, if you go back to the version of the chart on the
InformationIsBeautiful website, you'll notice that it currently says
version 1.35 along the bottom:
http://www.informationisbeautiful.net/visualizations/radiation-dosage-chart/
What's really interesting is that if you compare the Version 1.0 and
Version 1.35 charts, there are no significant differences other than
the removal of the 20,000 mSv cancer radiotherapy line.
In other words, as this chart got "upgraded," its content actually
got pared down.
And what exactly got cut from the chart?
The line
about cancer radiotherapy.
Again, I am not accusing the guys over at InformationIsBeautiful of
outright censorship or anything. There might be an innocent
explanation for all this. But I've seen before how knowledge gets
selectively removed from the most visible information sources,
keeping people in the dark about something that is quite literally
killing them.
So we'll see where this goes. I'm genuinely curious to see what
their response is to this article. If they're polite and have a
reasonable explanation for this, I'll do my best to pass it along.
Heck, maybe they'll even want NaturalNews to help promote some of
their upcoming charts on health issues such as vitamin D.
Their
charts are, after all, uber cool.
What are the
actual radiation doses used by the cancer industry?
In the mean time, you might be wondering about another possibility:
Is it possible that the line was pulled from the chart because it
was not accurate? Maybe it was a typo, and the cancer industry
doesn't even use that high of a dose.
Interestingly, a post beneath the chart on the Gizmodo thread,
posted by user scarbrtj, says:
Chart says 20,000
mSv (20 Gy) is a "highly targeted dose used in cancer
radiotherapy." Not really. That (very low) dose is almost never
used for any cancer.
For example, a dose of,
-
80,000 mSv (80 Gy)
is used for prostate cancer (and incidentally side effects are
minimal to zero long-term because the radiation is so targeted
in this case)...
-
60,000 mSv for breast cancer...
-
70,000 mSv for
lung cancer...
-
50,000 mSv for rectal cancer...
Not that random internet
posters have instant credibility or anything, but here we have a
user explaining that far higher doses are routinely used in other
cancer treatments.
Just to double check my facts here, I went looking for more
information on the actual radiation doses used in cancer treatments.
It turns out that 20,000 mSv (roughly 20 Gy) is on the low end.
Epithelial tumors, for example are routinely treated with 60 to 80 Gy!
Source: Wikipedia
Even more interestingly, doses of 45 - 60 Gy (roughly 45,000 -
60,000 mSv, see notes below) are used as a cancer prevention dose in
breast cancer and cancers of the head and neck.
The
radiotherapy scam exposed - again!
Just in case you're not following all this, what we're seeing here
is that 10,000 mSv is a fatal dose.
The 20,000 mSv line was removed
from the chart between versions 1.0 and 1.35. Meanwhile, the cancer
industry is routinely using 60,000 mSv focused on the head and neck
as a way to "prevent" cancer!
Are you starting to see how huge this cancer radiotherapy scam
really is? Think about it: If exposure to just 100 mSv can actually
cause cancer, then how can exposure to 60,000 mSv somehow "cure" it?
Not surprisingly, the cancer industry's lies fall apart when you
look at the science. No wonder the industry has to work so hard to
keep people misinformed. If cancer patients knew they were receiving
literally 60,000% higher radiation doses (that's 60,000 mSv versus
100 mSv) than the level necessary to significantly increase the risk
of cancer, they probably wouldn't sign up for more "treatments."
For the record,
mSv and
Gy units (Grays) don't always convert neatly
and nicely back and forth, so these numbers are approximate, and
they can vary based on the type of radiation and its so-called
"biological damage conversion factor."
As explained on the
RadProCalculator
website:
Rad and Gray are
absorbed dose units.
When we look at radiation being absorbed in
tissue, the absorption varies with the energy of the radiation.
With a higher energy deposition in tissue, there are more rads
or more Grays deposited than a lower energy deposition at the
same rate (particles or photons per second).
Now, what is a rem
and what is a
Sievert?
The term rem came from an acronym that
means
Roentgen Equivalent Man, in another words the equivalent
biological damage done to human tissue. Some radiation
emissions, when depositing the same energy as other radiation
emissions, do more biological damage to the human organism than
others.
How does one convert?
To go from rad to
rem or from Gray
to Sievert, you need a multiplication factor that represents the
effective biological damage. Most training texts call this a
quality factor (QF) or a radiation weighting factor. Some
training texts call it a biological damage conversion factor but
what it truly represents is the the ratio of biological damage
done by radiation types to the biological damage done by gamma
radiation.
For gamma, x-ray and beta radiation, this factor is
1. For alpha, it is 20. For neutrons it is between 3 and 10, and
is generally conservatively taken as 10. What this implies is
that a rad or Gray of alpha energy absorbed by soft human tissue
does 20 times more damage than a rad or Gray of gamma, x-ray or
beta energy absorbed.
Since for gamma, x-ray and beta, the
multiplication factor is 1, one rad equals one rem and one Gray
equals one Sievert.
So the actual
calculations of damage depend on what numbers you use for the QF
(radiation weighting factor).
But even if you're off by 10 or 20
percent, the dosage of radiation being used in cancer radiotherapy
is orders of magnitude higher than the dose needed to cause cancer
in a very high percentage of those people who are exposed.
The cancer industry's own treatments, it turns out, are its best
source of repeat business.
This is also true with chemotherapy, because the No. 1 side effect
of chemotherapy is - guess what? - cancer!
|


