|

by Max Roser
March 05,
2021
from
OurWorldInData Website

Who is
Considered Poor
in a Rich
Country?
And what does
this Mean for
our
Understanding of Global Poverty?
Our World in
Data presents
the data and
research to make progress
against the
world's largest problems.
This post draws on data and research
discussed in our
entries on
Income
Inequality, Global Extreme Poverty
and Economic
Growth...
Abstract:
The
extremely low poverty line that the UN relies on has the
advantage that it draws the attention to the very
poorest people in the world.
It
has the disadvantage that it ignores what is happening
to the incomes of the 90% of the world population who
live above the extreme poverty threshold.
The global poverty line that the UN relies on is based
on the national poverty lines in the world's poorest
countries.
In
this article I ask what global poverty looks like if we
rely on the notions of poverty that are common in the
world's rich countries like Denmark, the US, or
Germany.
Based on the evidence I ask what our aspirations for the
future of global poverty reduction might be.
In every country of the world there are people living in poverty.
Even in the world's richest countries the poorest people often live
in poor housing and struggle to afford basic goods and services like
heating, transport, and healthy food for themselves and their
family.
Those who are in monetary poverty also have much poorer living
conditions more broadly.
Even in a rich and relatively equal country
like Denmark middle-aged men who are among the poorest 20% of the
population die on average 9 years earlier than those among the
richest 20%. 1
In Denmark a person who
lives on less than $30 per day is considered poor and it is the
declared goal of the country to reduce poverty relative to this
threshold. 2
Countries
that are much poorer than Denmark also have the goal to
reduce poverty.
The United Nations declared the objective of
ending 'extreme poverty'
to be the number 1 goal of the global Sustainable
Development Goals.
According to the UN a person is considered to live in
extreme poverty when he or she is living on less than $1.90
per day, this is called the International Poverty Line.
According
to the latest global statistics about one in ten
people live in extreme poverty globally.
3
If we know
that poverty is a large problem even in high income
countries like Denmark where the poverty line is set at
around $30 a day, why should we use an International Poverty
Line that is so extremely low to measure poverty globally?
It is the
reality of our extremely unequal world in which every
tenth person lives in extreme poverty that makes such an
extremely low poverty line necessary. Without having an
extremely low poverty line we would not be aware of the
fact that a large share of the world lives in such extreme
poverty.
The UN's
global poverty line is valuable because it draws attention
to the reality of extreme poverty in our world.
In a world
where the majority still lives on very low incomes it would
be wrong if the UN decided to measure global poverty solely
by a poverty line as high as the poverty line of Denmark.
It would
mean that the global statistics gloss over the extremely
large and important income differences among the poorest
billions in the world.
It would
mean that the difference between those who live on only $1
per day and those who have an income that is more than
20-times higher would be entirely disregarded. They would
all be considered poor, and the reality that some of them
are much poorer than others would be hidden.
Slightly
higher global poverty lines such as the poverty line of
$3.10 per day that Kate Raworth relies on in her 'Doughnut'
framework, or the poverty line of $7.40 per day that
anthropologist Jason Hickel uses in his work, or Bob Allen's
absolute poverty line based on minimal nutritional
requirements all have the same value.
4
These low
poverty lines allow us to understand the material living
conditions of the poorest people in the world and have been
successful in drawing attention to the terrible depths of
poverty experienced by a large share of the world's
population.
The only
way to achieve these goals is to rely on extremely low
poverty lines.
Indeed
there is an argument for using an even lower poverty line.
To
understand what is happening to the very poorest in
the world, we need to look even lower than $1.90. This is
because one of the biggest failures of development is that
over the last decades the incomes of
the very poorest people have not risen.
A big part
of the reason for why this issue doesn't get discussed
enough is that the International Poverty Line we rely on is
too high to see this fact.
Yet,
only measuring global poverty relative to such
extremely low poverty lines has its own large downside.
By focusing
on an income threshold that is lower than the incomes of 90%
of the global population we are ignoring what is happening
to the majority of the world's population. This matters.
The
majority of the world do not live in extreme poverty
anymore, but billions are nevertheless living in great
poverty still.
The obvious
solution to the problem that the majority of the world is
not considered by the International Poverty Line is to use
an additional poverty line. This is not a new idea.
One poverty
researcher who has made the argument for an additional
higher global poverty line based on the notions of poverty
in rich countries is Lant Pritchett you find it in his
short, yet widely-cited essay 'The case for a high
global poverty line' from eight years ago.
5
Defining
global poverty lines
The
definition of poverty differs between countries. Poorer
countries set much lower poverty lines than richer
countries.
6
This means
that if we were to simply rely on national poverty
definitions for a global measure of poverty we would end up
with a measurement framework in which the fact where
a person happens to live would determine whether they are
poor or not:
If we
would count as poor those who are defined nationally as
poor we would end up counting a person who lives on $20
per day as poor in a rich country, while at the same
time counting a person who lives on $2 as not-poor when
they happen to live in a very poor country.
One way out
of this problem is to set global poverty lines based on the
national definitions, but to apply them globally.
This is how
the UN decided to define the International Poverty Line.
In order to
ground this global poverty line on something more than the
views of global poverty researchers, it is set based on the
existing definitions of poverty adopted in countries around
the world at the national level, but to avoid the problem
outlined above they apply the national poverty lines
globally.
As we
explain
here in some detail, the $1.90 per day poverty line is
set to reflect the national poverty lines adopted in the
world's poorest countries.
7
Applying
this poverty line globally means that a person who lives on
less than $1.90 per day is considered extremely poor no
matter where they live.
In recent
years the World Bank has applied this same methodology to
countries in the middle-income bracket, those countries with
a GNI per capita between $1000 and $12,500.
Based on
the poverty lines in these countries they have set
additional global poverty lines at $3.20 and $5.50 per day,
which are now
directly
available via the World Bank statistics.
8
What I want
to do here is to see what a global poverty line would be if
we rely on the notion of poverty in rich countries countries like Denmark, the US, or Germany.
9
That is what Pritchett suggested eight years ago:
"Since
the origin of the [International Poverty Line] was just
to adopt as a global lower bound the poverty lines used
by the poorest countries, it symmetrically makes sense
to say that the global upper bound poverty line is based
on the poverty line used in rich countries."
The
definition of poverty is certainly not an easy ethical
question and thoughtful people disagree about it in ways
that have meaningful consequences for our understanding of
the world.
There are
also interesting proposals for hybrid poverty lines that
combine absolute and weakly-relative measures, see Ravallion
(2019) for a recent proposal.
10
And I would
also recommend Tony Atkinson's last book 'Measuring
Poverty around the World' for an excellent recent
overview of the topic.
The basics of global
poverty measurement
Throughout
this article and in global income and
expenditure data generally the
statisticians who produce these figures
are careful to make these numbers as
comparable as possible.
First,
many poorer people rely on subsistence
farming and do not have a monetary
income.
To take
this into account and make a fair
comparison of their living standards,
the statisticians that produce these
figures estimate the monetary value of
their home production and add it to
their income/expenditure.
Second,
price changes over time (inflation) and
price differences across countries are
both taken into account: all measures
are adjusted for differences in
purchasing power.
11
To this
end incomes and expenditures are
expressed in so-called international
dollars. This is a hypothetical
currency that results from the price
adjustments across time and place.
An
international dollar is defined as
having the same purchasing power as one
US-$ in the US.
This means no
matter where in the world a person is
living on int. $30, they can buy the
goods and services that cost $30 in the
US.
None of
these adjustments are ever going to be
perfect, but in a world where price
differences are large it is important to
attempt to account for these differences
as well as possible, and this is what
these adjustments do.
12
Throughout
this text I'm always adjusting incomes
for price changes over time and price
differences between countries in this
way. All dollar values discussed here
are presented in int. $; the UN does the
same for the $1.90 poverty line.
Sometimes
I leave out 'international' as it is
awkward to repeat it all the time; but
every time I mention any $ amount in
this text I'm referring to
international-$ and not US-$.
13
An additional higher poverty
line of $30 per day
Pritchett
made his proposal based on data and prices a decade ago and
so it is necessary to update his calculations.
But I want
to go beyond Pritchett's approach and additionally provide a
number of other relevant comparisons to inform our
understanding of who is considered poor in a rich country.
By
following this idea I find that a poverty of 30
international-$ per day corresponds to the notion of poverty
in a rich country. In the following section I consider a
long number of benchmarks that made me arrive at this
poverty line.
Here is the
short summary of these comparisons:
The range
of possible higher poverty lines based on richer countries
is wide, as the list of benchmarks suggests.
At the
lower end I believe that it might be as low as $25 per day,
and on the higher end it might be as high as $40 or $50 per
day.
Just as
someone who lives on less than $1.90 per day is defined as
extremely poor, a person who lives on less than $30
a day could be considered moderately poor.
A reality
check for any poverty line you might want to consider is to
ask yourself what you think about living on less than that
poverty line yourself. I lived on less than $30 per day
before and would consider myself poor if I'd fall back on
that income level again.
In the
following box you find the sources and calculations of the
benchmarks that led me to my $30 per poverty line proposal.
Who is considered poor in
rich countries? Poverty lines and other relevant benchmarks
Poverty lines in European countries
As
mentioned before most European
countries set their poverty line at
60% of the median income in the
country.
In his
original proposal Pritchett was
relying on this 60% of median
cut-off.
Calculating the poverty line for
European countries therefore means
that we look up their median income
and then multiply it by 0.6. This is
less straightforward than it might
first appear. The reason for that is
that there are many different income
concepts.
You
quickly realize that it is not easy
to define a person's income if you
ask yourself what your own income
is.
Do
you take government transfers
into account or not?
Do
you take your partner's income
into account and divide it by
two?
How do you take into account
that you have a child for which
you need to pay?
It is
possible to take these and many
other aspects into account and
arrive at useful statistics, but
various sensible ways of addressing
such questions lead to many
different income metrics.
As
such, in comparing different poverty
thresholds across countries we have
to take care to avoid mixing
different income concepts as much as
possible.
One
important difference is how incomes
are adjusted for the size of the
household: whether the total
household income is simply divided
by the number of people (including
children) 'per capita' income or
whether some adjustment is made to
account for the fact that larger
households, and particularly
households with children, face lower
costs per person known as 'equivalised'
income.
Whereas EU countries, like other
rich countries, use equivalent
income to measure poverty, the UN's
measurement of global poverty is
based on a global dataset of per
capita incomes.
This
dataset is called
PovcalNet, and it is this that
we must use in order to make
comparisons of poverty measures in
different countries according to the
same income concept.
In
this dataset we find the median
income for countries around the
world and we can take that median
income and then apply the logic on
which the European poverty lines are
based. In the extensive footnote
here you find more details and the
full calculations.
14
As
high-income European countries I'm
referring to those European
countries, which
according to the Eurostat statistics
had a higher income in 2019 than the
European average.
These
are the following countries:
Finland, Netherlands, Belgium,
Sweden, Germany, France,
Iceland, Switzerland, Norway,
Luxembourg, Denmark, Austria,
Ireland, and the UK.
These
are the poverty lines for daily
income in a number of high-income
European countries (based on 60% of
the median incomes from PovcalNet):
-
Sweden: $29.40 per day
-
Norway: $37.80 per day
-
Austria: $31 per day
-
UK: $25.04 per day
-
Switzerland: $35.82 per day
-
Germany: $28.35 per day
-
France: $27.28 per day
-
Luxembourg: $43.86 per day
-
Finland: $27.22 per day
-
Iceland: $31.64 per day
-
Ireland: $24.68 per day
-
Netherlands: $28.6 per day
-
Belgium: $26.92 per day
-
Denmark: $29.06 per day
The
span of poverty lines in these
countries ranges from $25 (for the
UK and Ireland) up to $38 (for
Norway).
In the small country of
Luxembourg the poverty line is
higher.
The
poverty line in the US
Unlike
European countries, the US does not
set the poverty line in a relative
way. Instead the US poverty line
dates back to the work of Mollie Orshansky, an economist working for
the Social Security Administration
in the early 1960s.
Since
then it has been of course revised
for price changes, but otherwise it
remained unchanged.
The US
poverty line is
very often criticized as being
too low. Those that criticize the US
poverty line in that way therefore
suggest that the severity of poverty
in the US is understated in the
statistics.
How
high is the poverty line in the US?
In 2020 the poverty threshold for a
single person under 65 was 35
international-$ per day.
15
Now
the problem with comparing this
poverty line with the global
statistics is again that the income
concept is different. The US
crucially relies on an equivalence
scale for adjusting the income
cutoff depending on the household
size.
An
alternative is to apply the same
concept that the Europeans are using
for their poverty line
determination. If the US would use
the 60% of median income definition
of poverty their poverty line would
be int. $32.8 per day.
16
Very
close to the one-person poverty line
based on Orshansky's work.
A
somewhat comparable poverty line
based on these two approaches
therefore falls into the range of
around $33 to $35 per day.
Within
the range of poverty lines in
European countries.
Survey results Below which income do
you consider a person poor?
The UN and
Pritchett rely on the existing poverty
lines in low-income and high-income
countries respectively to derive their
poverty lines. We can follow other
approaches too.
An obvious
one is to ask what people out there
believe:
Who is
considered poor in a high-income
country by people in high-income
countries?
For the
regular poverty report of the German
government, a survey is conducted that
asks Germans below which income level
they consider someone as poor.
The latest
data is from the year 2015.
17
The mean
answer given by the German population
for a cutoff below which a person is
considered poor was 947€ per month. In
international dollars per day this
corresponds to an income of
int. -$37.58.
18
Universal Basic Income
Universal Basic Income
(UBI) is a political idea that is
becoming rapidly more popular.
A
large UBI study in Germany called
'Mein Grundeinkommen' sets
this income at €1200. In
international-$ this corresponds to
an income of int. $48.19 per
day.
19
Social
security in Germany
Germany pays basic social care for
its citizens. This social security
payment is referred to as 'Hartz-IV'.
How
much a person receives depends on
the particular circumstances of the
individual, but we can look at the
average payment. In 2018 a single
person
received on average 783 Euro per
month.
That corresponds to
int. -$30.78 per day.
20
The
Roslings' suggest a cutoff of $32
per day
Anna
Rosling-Rönnlund, Ola Rosling and
Hans Rosling challenged the old
dichotomy between developed and
developing countries in their
bestselling book 'Factfulness'.
They argue that the old dichotomy
corresponds to a view of the world
that was accurate half a century ago
when a few countries were relatively
well-off, but most countries were
living in very
poor conditions.
Today, they say,
people around the world live on a
large spectrum. To reflect this
spectrum they proposed 4 income
levels.
The
first cut-off corresponds to the
international poverty line (rounded
to int. $2 per day). The next income
cutoff they set at $8 per day, the
following one at $16 and the highest
one at int. $32 per day.
Kahneman's and Deaton's study of
income and emotional well-being
Nobel
laureates Daniel Kahneman and
Angus
Deaton published a famous study on
the link between life satisfaction
and income.
2
The
authors find that higher incomes go
together with higher self-reported
life satisfaction, but for people's
self-reported emotional well-being
this is only true up to a certain
point:
the study finds that above
$75,000 further increases in
income do not correspond with
improvements in people's
emotional well-being a finding
that is often cited to argue
that additional economic growth
does not improve people's lives
in high-income countries.
22
Again, the
income concept is not the same as that
in PovcalNet, and so comparisons with
the global data are not directly
possible.
But we can
ask what the daily income at which
emotional well-being supposedly levels
off corresponds to: $75,000 per year are
int. $205 per day.
It is
certainly worth considering whether an
income up to which emotional well-being
increases could be taken as the basis
for a definition of poverty.
A US
company reacted to the research finding
of Kahneman and Deaton by using it to
set the minimum wage in their company:
everyone in that company
gets paid that salary.
For the
discussion of global poverty however it
might be considered as an even higher
poverty line, but for any practical
purpose in the world today the income
cutoff would be too high as only a very
small fraction of the world lives on
more than $75,000 per year.
How many
people in the world live in poverty?
We have
seen that 10% of the world live in extreme poverty
as defined by the UN. How large is the share of the world
that lives in moderate poverty?
The latest
global data tells us that 85% of the world
population live on less than $30 per day.
These are
6.5 billion people...!
Relying on
a higher poverty line of $45 per day you find that 92% live
in poverty and using a lower poverty line of $20 per day you
find that 78% live in poverty.
No matter which of these
poverty lines you might want to choose, at least
three-quarters of the world live in poverty.
All of this
data refers to pre-pandemic times...
The global
recession has certainly increased the share below any of
these cutoff points. As soon as the new data is available
you will find it on Our World in Data.
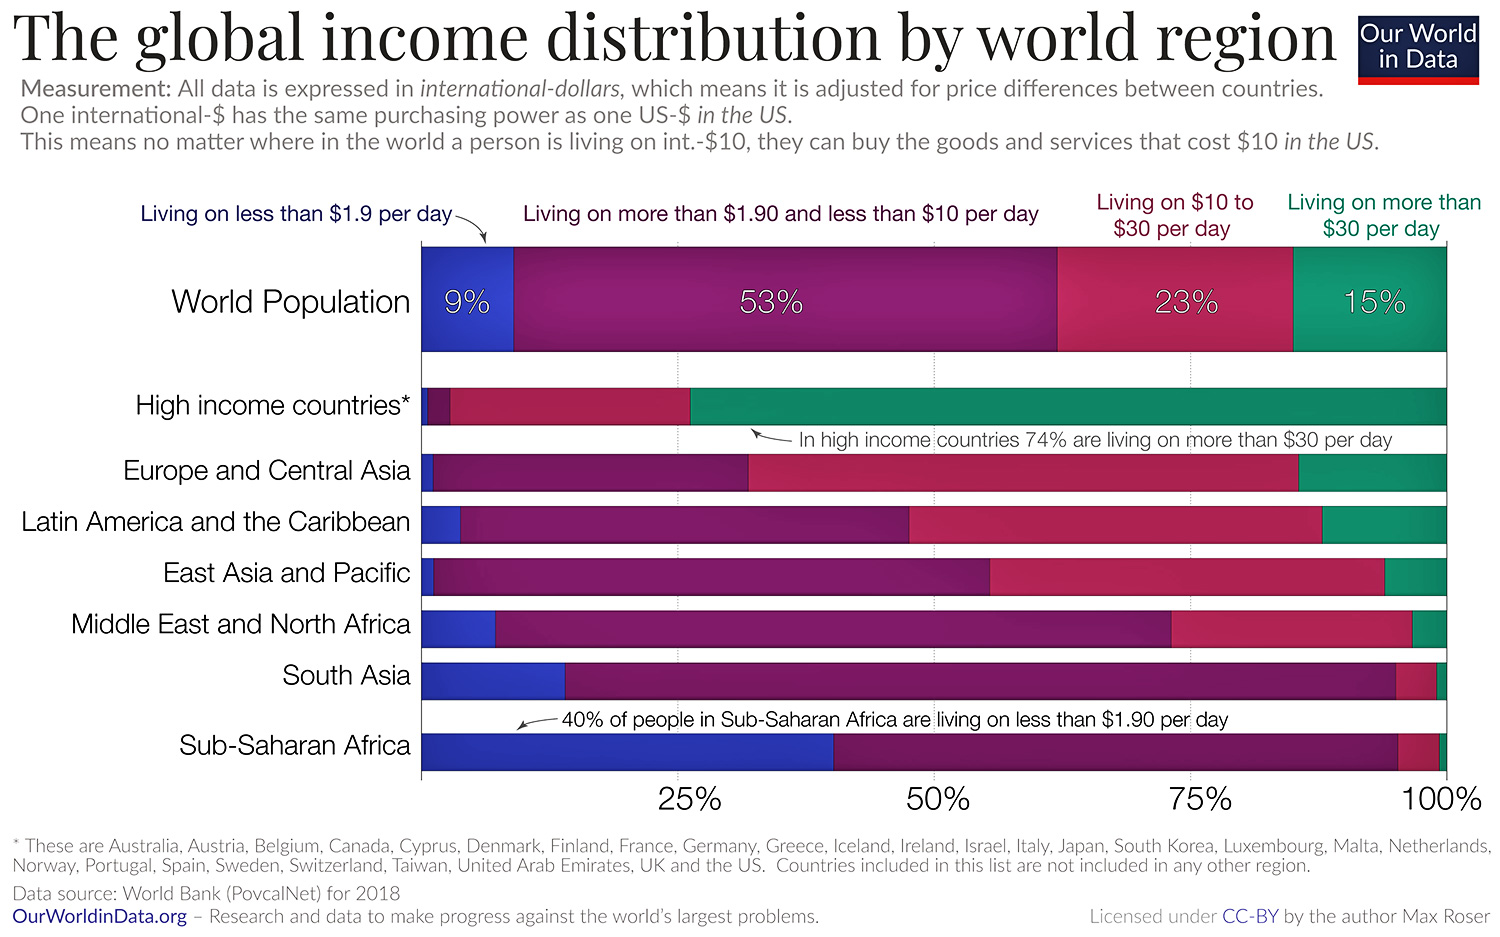
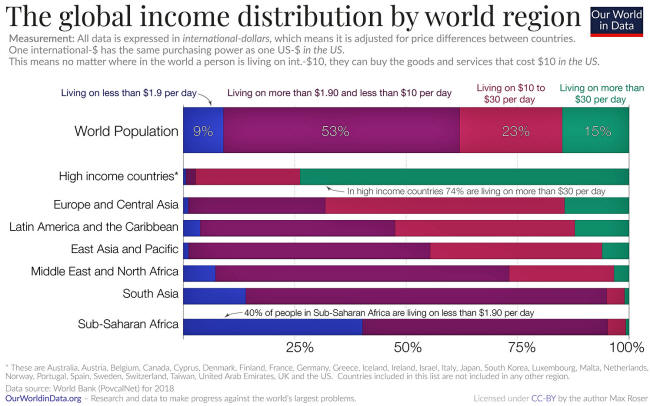
The chart
shows where in the world people are poor. If we would only
rely on the UN's extreme poverty line we would conclude that
barely anyone lives in poverty in high-income countries.
Relying on
higher poverty lines, this data here shows that even in
high-income countries there is a significant share of the
population that lives in poverty. No country, not even the
high-income countries, have eliminated poverty.
There are
no 'developed countries' there is work to do for all.
But just as
clear from this data is the fact that in many world regions
the large majority of people are very poor. In Sub-Saharan
Africa about 40% of the population lives on less than $1.90
per day as the chart shows.
In all
regions outside of high-income countries more than 85% of
all people live in moderate poverty.
Countries in
which the majority do not live in poverty have only left
poverty behind in recent history
Two
centuries ago the global income distribution was very
different.
Back then
almost everyone in the world was living in extreme
poverty. Those places in which few people live in moderate
poverty today only left poverty behind in the very recent
past.
Denmark is
one of those places. The reason why the majority of people
in Denmark is not living in poverty is that the economic
inequality is low and the average income high.
The fact
that the inequality is low you can see on the map. It shows
an inequality measure called the Gini coefficient (explained
here) which makes clear that Denmark is among the least
unequal countries in the world.
The reason
that the average income in Denmark is high is due to the
fact that average incomes have increased steadily for the
last two centuries, this long-term development is called
economic growth.
As the
historical data shows the average incomes in Denmark are
today more than 20-times higher than in the past.
You can add
any other country to this chart. By adding one of those
countries in which the majority lives in poverty like
Ethiopia you see just how large the differences in average
incomes are.
GDP per
capita is by far the most widely used measure of average
income and is yet another income concept from the two I
mentioned so far.
23
It is a
more comprehensive measure of incomes and crucially takes
into account government expenditures.
For these
and other reasons (mentioned in the long footnote) you will
find that dividing GDP per capita by 365 days will let you
arrive at a higher value than the income that is determined
in household income surveys.
24
Billions of
people live in countries where average incomes are very low
The income
of every person depends on two factors, the average income
in the country they live in and the position that particular
person has in that country's income distribution.
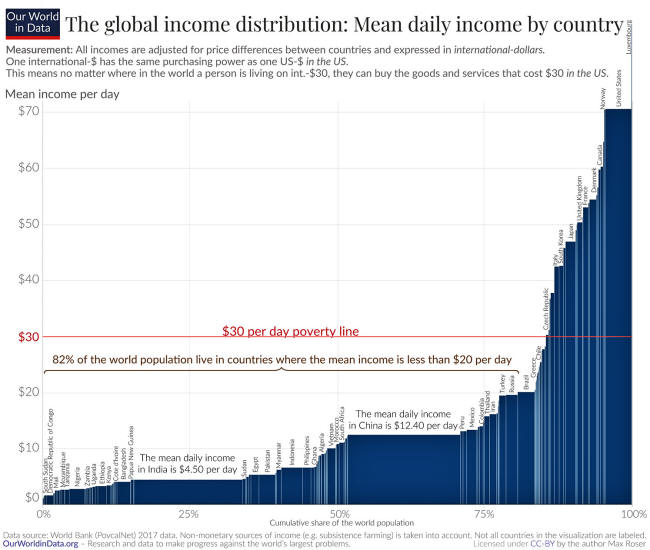
This chart
here shows the average income in countries around the world.
The height
of each bar represents the average daily income in a
country, the width of each country corresponds to the
country's population size.
I have
ordered the countries by income:
from
the poorest country on the very left (South Sudan where
the average person lives on $1.12 per day) to the
richest country on the very right (Luxembourg with an
average of $86 per day).
After two
centuries of economic growth the average income in Denmark
is now $57 per day today.
You find
the country far to the right in this chart, which tells you
that only very few countries in the world have such high
average incomes. The fact that the average income is far
higher than the poverty line tells us that the existing
poverty in Denmark discussed at the beginning of this post
is to a large extent the consequence of inequality.
What this
chart makes very clear is how low the average incomes in
many countries in the world are. The huge majority of the
world live in countries where the average income is
much lower than the poverty threshold in rich countries.
82% of the
world population live in countries where the mean income is
less than $20 per day. And where incomes are low, living
standards generally
are poor.
As the last
chart below shows, a child that is born into a poorer
country must not just expect to live on a very low income,
but also faces a much higher risk of not staying alive at
all.
As I have
said before, people are not poor because of who they
are, but because of where they are.
This is why
economic growth is so important to leave poverty behind. By
far the most important difference between those people who
are not living in poverty and those who do is the average
income in the country that they live in this single factor
matters more for a person's income
than all other factors taken together.
The
increase of average income in a country is called economic
growth and for global poverty to decrease substantially
economic growth for the poorest billions of people is
necessary.
The future of
global poverty
The world
today is far away from the 'end of poverty' relative to
any poverty definition.
After two
centuries of
unprecedented progress against the very worst poverty it
is still the case that every tenth person lives on less than
$1.90 per day.
As the
world has not even ended extreme poverty it is therefore
right to focus much of our attention on this very low
poverty cutoff; ending extreme poverty surely is a global
goal of great importance.
Yet at the
same time we should consider what our aspirations for the
future are. In the past our ancestors
did not know that it is possible for a society to leave
widespread poverty behind. Today we are in a different
situation.
We know
from the reality of today's rich countries that widespread
poverty is not inevitable.
Because we
know that poverty relative to such higher cutoffs is not
inevitable I believe it would be wrong to limit the
ambitions to eradicating poverty based on the definition of
poverty in the very poorest countries.
What I take
away from this discussion are three insights:
First,
we have seen from countries like Denmark that it is
possible to reduce poverty for an entire population
relative to a poverty line of about $30 per day.
Second,
we have seen that these countries were extremely poor in
the past and were able to reduce poverty over the course
of the last few generations.
And
third we have seen that the huge majority of the world
is still living in great poverty, by any standard.
What this
suggests to me is that the history of global poverty
reduction has only just begun...
Endnotes
-
Brønnum-Hansen
H, Foverskov E, Andersen IIncome inequality in life
expectancy and disability-free life expectancy in DenmarkJ
Epidemiol Community Health 2021;75:145-150.
https://jech.bmj.com/content/75/2/145
-
For the
moment it is important to note that this $30 per day poverty
line is defined in international-$ and therefore comparable
with the 'International Poverty Line' discussed in the
following section. Much more details about how to compare
incomes across countries, the income concept here, and the
definition of this poverty line follows further below in
this text.
-
Before the
pandemic
9% lived below this poverty line. Due to the global
recession the share in extreme poverty is expected to
increase this year to over 10%.
-
Kate
Raworth (2017) A Doughnut for the Anthropocene: humanity's
compass in the 21st century. In The Lancet Planetary Health.
Volume 1, Issue 2, E48-E49, May 01, 2017. Open Access DOI:
https://doi.org/10.1016/S2542-5196(17)30028-1 You find
the metrics that the Doughnut relies on
in the Appendix here.
Jason Hickel
Could you live on $1.90 a day? That's the international
poverty line and
here.
Allen, Robert C.(201). Absolute Poverty: When
Necessity Displaces Desire. American Economic Review,
107 (12): 3690-3721.DOI: 10.1257/aer.20161080
-
Lant
Pritchett (2013) Monitoring progress on poverty: the case
for a high global poverty line. Online here
https://www.odi.org/sites/odi.org.uk/files/odi-assets/publications-opinion-files/8440.pdf
-
Jolliffe
and Prydz (2016)
-
Specifically, the line is set at the average national
poverty line amongst 15 particular low-income countries. As
Jolliffe and Prydz (2016) demonstrate however, this is also
the average poverty line found among in the poorest quarter
of countries with available data, and also among countries
falling into the World Bank's low-income category.
-
The study
on which these thresholds rely is Jolliffe, D., Prydz, E.B.
Estimating international poverty lines from comparable
national thresholds. J Econ Inequal 14, 185–198 (2016).
https://doi.org/10.1007/s10888-016-9327-5 The
researchers also report an average high-income country
poverty line of $21.70 per day.
High income countries in the World Bank framework are
however relatively poor compared to the countries that I'm
focusing on here the cutoff for a high-income country
according to the World Bank is $12,536, about a quarter of
the GNI of Germany and only a fifth of the US. Accordingly
the poverty cutoff is much lower than in those countries.
Here you find the World Bank income classification cutoffs.
-
The range
of incomes considered 'middle' and 'high' income countries
according to the World Bank are very low relative to rich
countries. High-income economies are those with a GNI per
capita of $12,536 or more. The range of middle-income
economies begins at a GNI per capita of $1,036. In this post
I want to rely on countries like Denmark; higher income
countries by any standard.
-
Martin
Ravallion (2019)
On Measuring
Global Poverty. NBER Working Paper 26211. DOI
10.3386/w26211
-
This is
possible by relying on the work of the
International Comparison Project, which monitors the
prices of goods and services around the world.
-
Angus
Deaton and Alan Heston (2010) discuss the methods behind
such price adjustments and many of the difficulties and
limitations involved.
Deaton, A.,
and Heston, A. 2010. "Understanding PPPs and PPP-Based
National Accounts." American Economic Journal:
Macroeconomics 2 (4): 1–35. A working paper version is
available online
here.
-
Keep in
mind that in the special case of the US the US-$ equals the
international-$.
-
The
European reference incomes are national median equivalised
disposable income after social transfers.
The
disposable household income including all income from work
(employee wages and self-employment earnings), private
income from investment and property, transfers between
households, and all social transfers received in cash
including old-age pensions.
Eurostat
applies an equivalisation factor calculated according to the
OECD-modified scale first proposed in 1994. The UN/World
Bank is not.
This is
according to Eurostat
here, where you also find the relevant data. (If the
link should break, search on Google for 'Distribution of
income by quantiles EU-SILC and ECHP surveys'.)
There are
various ways of bringing the national poverty lines with
reference to the national median equivalised disposable
income after social transfers in line with the
income/expenditure concept used in PovcalNet.
Joliffe and
Prydz follow a different approach and their paper is very
relevant for anyone interested in this question here. One
alternative to the approach I'm following in this article
would be to start from the poverty lines they estimated
(based on the poverty headcount ratio) and apply the growth
rate of the median income since the publication of their
study. Yet another possibility would of course be to repeat
their analysis with the up-to-date data. I am not following
either of these approaches because I believe for a wide
audience they are less transparent that the approach here which is simply: I rely on the same dataset so that I rely
on the same income concept, then look up the median income
and multiply it by 0.6.
This is the
reference: Jolliffe & Prydz (2016). Estimating international
poverty lines from comparable national thresholds. The
Journal of Economic Inequality, 14(2), 185-198.
–––
The
following are the relevant calculations. All of them are
based on PovcalNet data:
Germany's
median monthly income in 2017 was $1417.29 according to
PovcalNet.
60% of the median expressed in daily income/consumption is
0.6*$1417.29=$850.374/30=$28.35 per day
Sweden's
median monthly income in 2017 was $1469 according to
PovcalNet.
60% of the median expressed in daily income/consumption is
(0.6*1469)/30=$29.38 per day
Norway's
median monthly income in 2017 was $1890 according to
PovcalNet.
60% of the median expressed in daily income/consumption is
(0.6*1890)/30=$37.8 per day
Austria's
median monthly income in 2017 was $1534 according to
PovcalNet.
60% of the median expressed in daily income/consumption is
(0.6*1534)/30=$30.68 per day
In the
UK the median monthly income in 2017 was
$1252 according to PovcalNet.
60% of the median expressed in daily income/consumption is
(0.6*1252)/30=$25.04 per day
France's
median monthly income in 2017 was $1364 according to
PovcalNet.
60% of the median expressed in daily income/consumption is
(0.6*1364)/30=$27.28 per day
Switzerland's
median monthly income in 2017 was $1791 according to
PovcalNet.
60% of the median expressed in daily income/consumption is
(0.6*1791)/30=$35.82 per day
Spain's median
monthly income in 2017 was $982 according to PovcalNet.
60% of the median expressed in daily income/consumption is
(0.6*982)/30=$19.64 per day
Iceland's
median monthly income in 2017 was $1582 according to
PovcalNet.
60% of the median expressed in daily income/consumption is
(0.6*1582)/30=$31.64 per day
Luxembourg's
median monthly income in 2017 was $2193 according to
PovcalNet.
60% of the median expressed in daily income/consumption is
(0.6*2193)/30=$43.86 per day
Netherland's
median monthly income in 2017 was $1430 according to
PovcalNet.
60% of the median expressed in daily income/consumption is
(0.6*1430)/30=$28.6 per day
Belgium's
median monthly income in 2017 was $1346 according to
PovcalNet.
60% of the median expressed in daily income/consumption is
(0.6*1346)/30=$26.92 per day
Denmark's
median monthly income in 2017 was $1453 according to
PovcalNet.
60% of the median expressed in daily income/consumption is
(0.6*1453)/30=$29.06 per day
Ireland's
median monthly income in 2017 was $1234 according to
PovcalNet.
60% of the median expressed in daily income/consumption is
(0.6*1234)/30=$24.68 per day
Finland's
median monthly income in 2017 was $1361 according to
PovcalNet.
60% of the median expressed in daily income/consumption is
(0.6*1361)/30=$27.22 per day
-
According
to the "Annual
Update of the HHS Poverty Guidelines" the poverty line
in the US is an annual income of US$12,760. [And
12,760/365.25=$34.95.]
-
The
US median monthly income in 2017 was $1640
according to PovcalNet.
60% of the median expressed in daily income/consumption is
(0.6*1640)/30=$32.8 per day
-
These
reports are called 'Armuts- und Reichtumsbericht der
Bundesregierung' online at
armuts-und-reichtumsbericht.de
The latest
survey was produced by aproxima and published in 2016. It is
published as
Wahrnehmung von Armut und Reichtum in Deutschland,
Ergebnisse der repräsentativen Bevölkerungsbefragung „ARB-Survey
2015", Berlin: Bundesministerium für Arbeit und Soziales
(Hrsg.).
-
The 2011
PPP conversion factor for private consumption (LCU per
international $) for Germany in 2015 is 0.84 according to
the World Bank
here.
This means
the perceived poverty threshold corresponds to
€947/0.84=int. $1,127.38 per month or int. $37.58.
-
The 2011
PPP conversion factor for private consumption (LCU per
international $) for Germany in 2017 is 0.83 according to
the World Bank
here.
This means
the UBI corresponds to 1200/0.83=int. $1,445.78 per month or
int. $48.19.
-
That's
€783/0.834=int. $938.85 per month. Or
int. $938.85/30.5=int. $30.78
per day.
-
Kahneman
and Deaton (2010) High income improves evaluation of life
but not emotional well-being. Published in the Proceedings
of the National Academy of Sciences. https://www.pnas.org/content/107/38/16489
-
Kahneman
and Deaton analyze two different concepts self-reported
satisfaction:
- Emotional
well-being refers to the "emotional quality of an
individual's everyday experience the frequency and
intensity of experiences of joy, stress, sadness, anger, and
affection that make one's life pleasant or unpleasant."
- Life
evaluation refers to the thoughts that people have about
their life when they think about it.
The authors
find that higher incomes go together with higher
self-reported life satisfaction in both metrics. What they
emphasize is that at very high incomes this is not true
anymore emotional well-being does not increase over around
$75,000. Evaluation of life however continues to increase
even at incomes over $75,000.
-
The two
previous ones were income/expenditure as determined in
household surveys and equivalised disposable income after
social transfers.
-
There is
generally a gap between GDP per capita and the averages
found in both income surveys and expenditure surveys. But
the reasons for the gap are different depending on which we
are comparing.
GDP
includes many items that are typically not measured in
household income surveys, such as an imputed rental value of
owner-occupied housing, the retained earnings of firms and
taxes on production such as VAT. The gap is even larger when
GDP is compared to surveys of household consumption the
latter concept excluding both investment expenditure and
government expenditure on public services such as education
and health.
Other
aggregates beyond GDP are available in the national accounts
that are more comparable to the concepts applied in
household income and consumption surveys. However important
differences still remain even here. For example, in addition
to imputed rents, imputations for the value of certain
financial services, such as bank accounts, are included in
aggregate household consumption measured in national
accounts, with no equivalent for these items recorded in the
survey data. In many countries the consumption of 'nonprofit
institutions serving households' (NPISH) is included as part
of household consumption within national accounts, but not
within household surveys.
On top of
these conceptual differences are a range of mismeasurement
problems that affect both sets of data. On this topic see
Deaton (2005), and Pinkovskiy and Sala-i-Martin (2016).
Deaton,
Angus. 2005. "Measuring Poverty in a Growing World (or
Measuring Growth in a Poor World)." The Review of Economics
and Statistics 87 (1): 1–1.
Pinkovskiy,
Maxim, and Xavier Sala-i-Martin. 2016. "Lights, Camera…
Income! Illuminating the Nation"
|