|

by James Edward Kamis
September
15, 2023
from
ClimateChangeDispatch Website
|
James Edward Kamis
is
a retired Geologist with forty-two years of experience.
He
has a Bachelor of Science degree in Geology from
Northern Illinois University and a Master of Science
degree in Geology from Idaho State University.
More
than forty-six years of research have convinced him that
geological forces significantly influence, or in some
cases, completely control climate, and climate-related
events as per his Plate Climatology Theory and latest
book. |

There is an enormous amount of data that proves
El Niño
and La Niña significantly alter the Pacific Ocean's
temperature, influence Earth's atmospheric temperature, reverse
equatorial trade winds, and change our climate.
It may come as a surprise that armed with all this information,
scientists still don't know what generates El Niño and La Niña...
This article will show that,
massive amounts of
heated fluids, cooled fluids, chemicals, and various gases
emitted from seafloor geologic features located at a
non-moving/fixed location in a far western part of the Pacific
Ocean, i.e., the "Source Point",
...generate and maintain
both El Niño and La Niña.

Figure 1.
Comparison of the 1997 – 1998
El Niño
and La Niña events.
Note
that each has the same Source Point
and
temperature distribution patterns.
(Image
credit NOAA and some labeling by J. Kamis).
Source Point
All El Niño and La Niña originate in the exact same deep ocean
seafloor area which is located east of
Papua New Guinea and west of
the
Solomon Islands (Figure 2).
The Source Point covers
150,000 square miles, which is a mere 0.23 percent of the Pacific
Ocean's 64,092,958 square miles.
The Source Point's
area is one of the most
geologically active regions on Earth because it is home to,
-
the
junction of five extremely active major fault systems
-
the second largest ocean floor lava plateau on Earth
-
hundreds of
ocean floor volcanoes
-
a tremendous number of ocean floor
hydrothermal vents...

Figure 2.
Ocean floor geology of the El Niño and La Niña
(Image credit Schmidt Ocean Institute,
some
labeling by J. Kamis).
Generation of El Niño and La Niña
-
When an
enormous deep-earth molten lava chamber that is far beneath
the Source Point becomes active, it super-pressurizes gases
within the lava in the chamber, primarily CO2.
The
pressurized lava then pushes upward through lower-pressure
rock layers eventually spilling out onto the ocean floor
where it creates and fuels many types of geological
features.
This
process marks the beginning of an El Niño.
-
The ocean
floor's geological features then begin emitting massive
amounts of extremely hot fluids, chemicals, and gases into
the lower ocean layer.
However,
these emissions don't increase the temperature of the ocean
layer beneath the Source Point area.
This is
because the temperature of the heated fluids, chemicals, and
gases also act to melt massive deposits of vertically and
horizontally oriented ice-bearing rock layers - layers
generated before the emergence of the lava pocket activity.
These
layers are typically very thick and stretch for miles away
from the Source Point.
-
It takes a
significant amount of time until the emitted heat melts a
large portion of the icy rock layers.
-
Once the
icy rock layers melt, the emissions of heated fluids,
chemicals, and gases begin to greatly increase the
temperature and chemical composition of the ocean water.
The heated
water gets transported eastward by ocean currents that act
to form an immense, heated, three-dimensional area that
extends from the Source Point to South America.
However,
the three-dimensional area still has pockets of cooler
water. In time the area completely warms to the same
temperature.
This is now
a fully formed El Niño...
-
When the
activity of the deep-earth lava pocket diminishes, the
temperature of the fluids, chemicals, and gases it emits
from the lava pocket also decreases.
At some
point, the decreasing temperature reaches a tipping point
that is conducive to reestablishing all the icy rock layers
to their original extent.
The cool
water gets transported eastward by ocean currents that act
to form an immense, heated, three-dimensional area that
extends from the Source Point to South America.
However,
the three-dimensional area still has pockets of warmer
water. In time, the area becomes completely cooled to the
same temperature.
This is now
a fully formed La Niña...
-
When the
lava chamber becomes totally inactive and no longer emits
fluids chemicals or gases, the El Niño and La Niña phases
end.
Helium Gas Emitted from The El
Niño and La Niña Source Point
Figure 3 is a map
showing the concentration of helium gas in seawater across a large
portion of the Pacific Ocean.
The presence of
helium gas plumes is a very strong indicator that the gas was
emitted from an erupting volcano. Note that the source point of the
helium plume in Figure 3 perfectly matches the Source Point of the
El Niño and La Niña.
This is very
convincing evidence that the
generation of all El Niño and La Niña is the result of
geological activity...

Figure 3.
Ocean Surface Helium Gas Plume
that emanates from the ocean floor
Source Point of El Niño and La Niña.
(Data and map credit NOAA and Luton 2017).
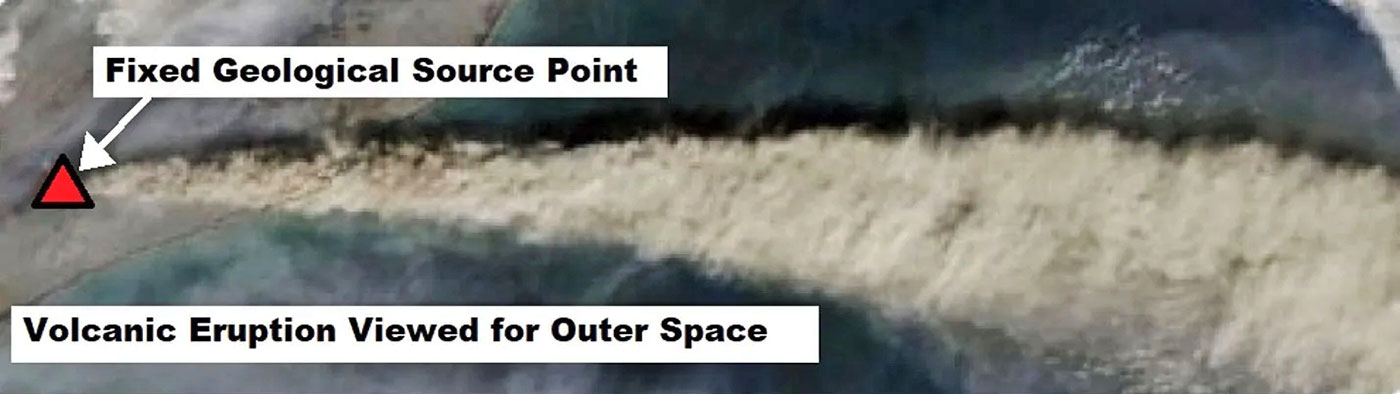
El Niño Volcanic Eruption Analog
Figure 4 is a photo
of volcanic ash being expelled from an erupting land volcano.
The fixed source
point, "V"-shape pattern of the ash, and its transition from high
ash concentration to no ash construction is an analog of an El Niño.

Figure 4.
Photo of a volcanic eruption
from space taken by NASA's Endeavour Space Shuttle
(image credit NASA's Space Shuttle Program,
some labeling by J. Kamis).
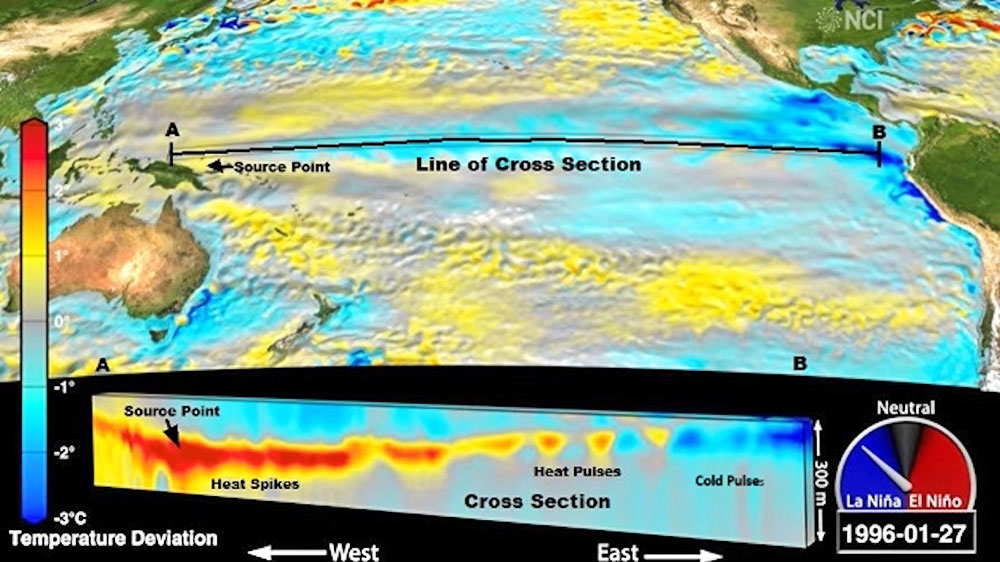
Three-Dimensional
Time-Lapse Video Illustrating an El Niño and a La Niña Generation
Figure 5 is a snapshot of a three-dimensional time-lapse video
illustrating that El Niño and La Niña begin at the Source.
The downward-pointing Heat Spikes are formed by emissions from the
hot lava pocket...
As you watch the video it
becomes apparent that both the El Niño and La Niña form in bursts:
Eventually, the cumulative effect of the bursts generates a fully
formed El Niño or La Niña.
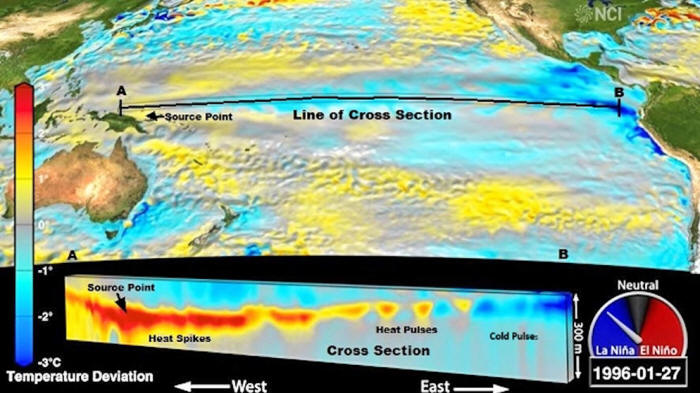
Figure 5.
Development of El Niño warm phase
and La
Niña cool phase
(Source: YouTube screencap see here).
(Some
labeling by J. Kamis).
Side Effects
vs. Root Cause
Scientists
attempting to decipher what
force or forces generate and maintain El Niño and La Niña use
the vast amount of atmospheric and oceanic data to formulate their
conclusions.
Utilizing this data
scientists have found correlations of,
...it shows these correlations are side effects of
geologically induced El Niño and La Niña.
This is not to say
that all changes in trade winds, ocean currents, climate phenomena,
and climate are related to geological forces.
Rather, during El
Niño and La Niña, changes in the above parameters are caused by
geological forces...
High-Resolution Mapping of
Earth's Ocean Floors
Oceans cover 71% of
the earth yet the number of geological features present on its ocean
floors is not well known primarily due to the lack of
high-resolution elevation mapping.
High-resolution
elevation mapping is needed to image the limited height and width of
ocean floor geological features.
It would seem that,
these small ocean floor features would have little effect on the
temperature, chemical composition, amount of CO2 rising
into the atmosphere, and amount of methane gas rising into the
atmosphere.
The opposite is
true...
Modern research
studies have concluded that emissions from thousands of small land
geological features have an
underestimated effect on climate.
A University of
Cambridge study concluded that
climate models should be updated to include the climate effect
of land volcanic activity. They attribute this underestimation to a
lack of including the thousands of small land volcanic features.
You may ask how is
all this relevant to the generation of El Niño and La Niña.
The answer is
that higher resolution elevation mapping of the ocean floor in
the Source Point area will likely find hundreds of heretofore
undiscovered active volcanoes and hydrothermal vents.
These additional
features geological may add credence to the idea that geological
activity generates El Niño and La Niña.
The primary source
of data that measures the temperature, pressure, and salinity of the
upper and middle ocean layers is the
ARGO Buoy System.
As of 2015, the
ARGO system forms a worldwide network of 3,881 autonomously
operating buoys. Each buoy can
vary its depth from the ocean surface to 6,562 feet and vary its
geographic position.
When the buoys
descend to a depth of 6,562 feet, they record their GPS position,
ocean floor temperature, ocean floor pressure, and ocean floor
salinity, which is then stored in an onboard computer.
When a buoy rises
to the surface it transmits its GPS position, ocean floor
temperature data, ocean floor pressure data, and ocean floor
salinity data to satellites.
This data is
utilized to construct low-resolution three-dimensional maps of
temperature, pressure, and salinity at 6,562 feet.
The maps are low
resolution for several reasons.
Earth's oceans
cover 139,700,000 square miles, which means there is only one
ARGO buoy every 36,000 square miles.
In other words,
the
ARGO buoys are widely spaced and therefore don't provide
enough data to resolve how geological features are present in
our oceans.
The current
estimate of how many geological features are present on ocean floors
is 3,000,000.
Once the elevation
of all of Earth's ocean floors is mapped in high resolution, this
estimate will be substantially higher.
Other Evidence that El Niño and
La Niña are Generated by Geological Forces
-
The rare
occurrence of three La Niña in a row termed a Triple La
Niña, occurred from 2020 to 2023.
This event was immediately
followed by a
still-developing El Niño.
The amount
of energy needed to cool and then maintain the below-average
temperature across a huge portion of the Pacific Ocean for
three years is immense.
A greater
amount of energy is required to quickly increase the
temperature of a huge portion of the Pacific Ocean into a
warm El Niño phase.
This large
amount of energy can only be supplied by energy emissions
from a deep earth molten lava pocket.
-
The
amount of energy needed to generate an El Niño within an
ocean floor geologically active area measuring 20 by 30
miles has here been very roughly estimated.
The known
energy released from a 20 by 30 miles portion of
Yellowstone's Pitchstone volcanic Plateau is roughly the
same amount needed to form an El Niño.
Interestingly, Yellowstone and the El Niño Source Point are
both associated with deep earth molten lava pockets.
-
El Niño do
not occur in a predictable historical pattern, rather they
occur randomly.
This is
indicative of a geological origin such as volcanic eruptions
which are not predictable.
-
El
Niño-like events do not occur elsewhere in the Pacific or
other oceans.
Why? If
they are atmospheric in origin, there should at least be one
other El Niño location.
-
Historical
records indicate that the first human-recorded El Niño
occurred in 1525 observed by Spanish explorers.
Other
studies suggest strong ancient El Niño ended Peruvian
civilizations. The main point here is that strong El Niño
are natural, and not increasing in relationship to global
warming.
-
El Niño
often occur in "bundles".
Typically,
the first El Niño in a bundle is of lower intensity,
subsequent El Niño are progressively more intense, often
ending with a high-intensity El Niño.
This El
Niño bundle pattern is remarkably like the progression of
well-monitored and well-understood land-based volcanic and
tectonic events, which typically build through time to a
final
large volcanic eruption or tectonic event.
-
The ocean
surface shape of all El Niño Sea Surface temperature
anomalies is identical.
If El Niño
were the result of global atmospheric warming, there should
be some variance in shape.
-
Ocean
warming acts strongly affects ocean coral reef systems,
often referred to as "coral bleaching".
I believe
that the alteration of coral reefs is a natural and
necessary effect caused by geologically induced El Niño.
Effects
that fit into the Natural Selection Theory developed by
geologist Charles Darwin while visiting the geologically
active Galapagos Island Rift System region.
Take for
example the U.S. Forest Service's "Forest Fire Suppression
Policy" that reigned supreme from 1900 until 1995.
During this
time, forest fires were considered extremely dangerous and
harmful to both the public and forests.
Foresters claimed
that these monstrous walls of destruction that raged through
our beautiful forests killing humans, animals, and plants,
and destroying homes were unnatural and needed to be
suppressed.
Today's
forest management policies are quite different.
The new
policies are built on the premise that forest fires are
necessary agents of natural selection.
-
El
Niño-warming and chemical changes of Pacific Ocean seawater
have a strong influence on Pacific Ocean phytoplankton
distribution by enriching the ocean with iron, phosphorus,
etc.
Geological
emissions from active ocean floor features are known to emit
these minerals.
-
All El
Niño/La Niña computer prediction models loaded with
atmospheric and shallow oceanic data consistently fail,
likely because they are modeling the "side effects" of
geologically warmed/cooled oceans and not the "cause" of the
El Niño/La Niña event.
All of
these models, including the current model, do not have the
ability to project the timing of occurrence, magnitude,
frequency, generation by heat pulses, and "bundling"
patterns more than a few months in advance.
-
El Niño/La
Niña events are associated with geological seismicity or
volcanism in the point source area (Guillas 5-28-2010).
-
It is
evident the generation of an El Niño is immediately followed
by the generation of a La Niña proving that one cycle and
not separate events.
Summary
Significant amounts
of data and information gathered from varying scientific disciplines
prove that the generation of El Niño and La Niña is the result of
fluids, chemicals, and gases emitted from ocean-floor geological
features.
Features that are
located in a small geographical area in the far western portion of
the Pacific Ocean.
|