by Roger Higgs

September 23, 2021
from Principia-Scientific Website


Solar Influences

Data Analysis Center


Global warming--cooling mimic solar variations (150-year delay), absolving CO2, portending 50 cooler years, confirming NASA-HadCRUT inflated 1980-2020 warming

Published high-resolution graphs of solar activity and Greenland temperatures (proxies; Wu, Vinther) of the last 9,000 years (9ky) strongly correlate visually, with clearly matching spikes and centennial-millennial trends (Slide 2).

(Contrast Marcott graph of global Holocene temperature, spikeless due to lower resolution and smoothing, Slide 2 inset).


The correlation is even clearer after back-tilting (de-trending) the temperature graph to compensate for long-term cooling by Earth's declining obliquity (Slide 2 inset).


Image: Herrera et al 2015


An obvious temperature delay of 100-200y (Slide 2) is attributable to oceanic thermal inertia (vast heat capacity, slow AMOC global circulation; cf. Abdussamatov 15-20y theoretical lag).


The lag aligns, for example, the 8.2-kiloyear event cooling-warming couplet (nadir 6210BC) with an exceptional solar grand minimum-maximum couplet (nadir 6435BC), and aligns Modern 'Warming' (from 1850; ongoing recovery from Sun-driven Little Ice Age) with the Sun's 1695-1958 AD surge,

Likewise the strongest in 9ky (Slide 2).


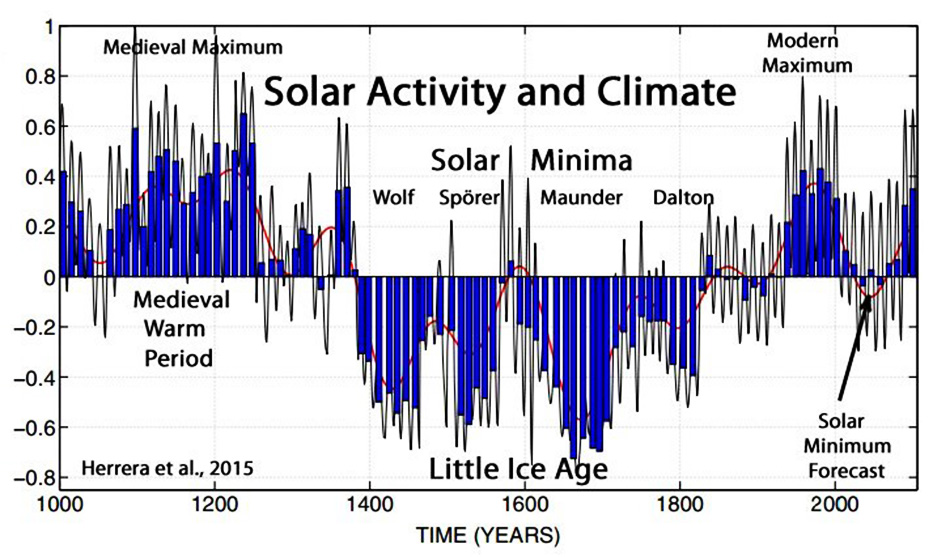
Focusing on the last 1ky, solar output (Brehm) matches global temperature (PAGES2k); 150-200y lag aligns the Little Ice Age (1440-1920) and the Wolf-through-Maunder solar minima (1270-1720; Slide 3).


Lastly, the NASA and HadCRUT near-identical global thermometer graphs mimic the smoothed 1700-2020 sunspot series; 140-160y lag aligns their respective modern surges and multi-decade downturns (e.g. 1795-1820 Dalton Minimum equates to 1945-75 cooling; Slide 4).

Exposing NASA-HadCRUT inaccuracy, the correlation predicts roughly equal warmth for the1930-50 ('dustbowl') and 2000-20 warm spells (based on equality of their corresponding solar 'humps'; Slide 4), but NASA-HadCRUT claim 2000-2020 was far (~0.7C°) warmer (Slides 5, 6), this despite their own Arctic differential being less (~0.5C°; Slide 5), violating polar amplification.

The 2000-2020warm interval follows (and continues) 20yof land (surface-air) warming supposedly twice as fast as sea-surface temperature (SST; Slides 4, 6); inexplicably this began abruptly (1980; Slide 6).

Such land-sea decoupling is impossible because SST dictates average land-air temperature (Humlum; presumably by advection of sea air warmed [or cooled] by the sea), as evidenced also by their equality (within error) up until 1980 (Slide 6).


This confirms NASA-HadCRUT inflated post-1980 land temperatures by improper urbanization adjustments (McKitrick, Richard, Heller, Connolly).


In the entire 9ky, the only resemblance between CO2 and temperature is their simultaneous surge from ~1850 (Industrial Revolution onset) (Slide 7).

But CO2 is accelerating, unlike warming (except manipulated land graph, Slide 6); and CO2 does not express the 1880-1910 and 1945-75 coolings, or the 1998-2012 hiatus (Slide 7); nor does it express any of the pre-1850 warmings that rivaled Modern Warming's rate (Slide 7).


Thus our Sun drives climate (Denton); CO2's theoretical greenhouse-warming potential, already (at 400pm) reduced "well into the saturation regime" (van Wijngaarden), must be cancelled by negative feedbacks (Higgs1, Higgs2).


Knowing oceanic lag is ~150y enables temperature prediction.

Cooling in progress since the2016 warm peak (equates to 1870 peak of Sunspot Cycle 11, Slide 4) will last another 5-10y (Cycle 11 to 12 sharp decline).


Relative coolness will ensue for 50-60y (weak Cycles 12-16).


Subsequent warming (rise from Cycle 16) will climax ~2110 (~150y after Cycle 19 sunspot superpeak of 1958) or 2140 (Cycle 22 magnetic superpeak 1991), depending on which solar property drives climate (Svensmark).

Maximum temperatures will possibly exceed those of 6600-5600BC (Slide 2).


Decades of cooling will follow (ongoing solar decline since 1958/1991; Slide 4).

See more here...!