|

by Tomer (Tom)
Tamarkin
October 10,
2022
from
ClimateCite Website

"The net
amount of equilibrated
carbon
dioxide (CO2) in the atmosphere
is the same as
if human beings never existed.
Climate change
is a natural phenomenon
and not
man-made."
On March 19, 2020 the State of California became the first state to
issue a stay-at-home order, mandating all residents stay at home
except to go to an essential job or shop for essential needs.
Within weeks most of
the world followed...
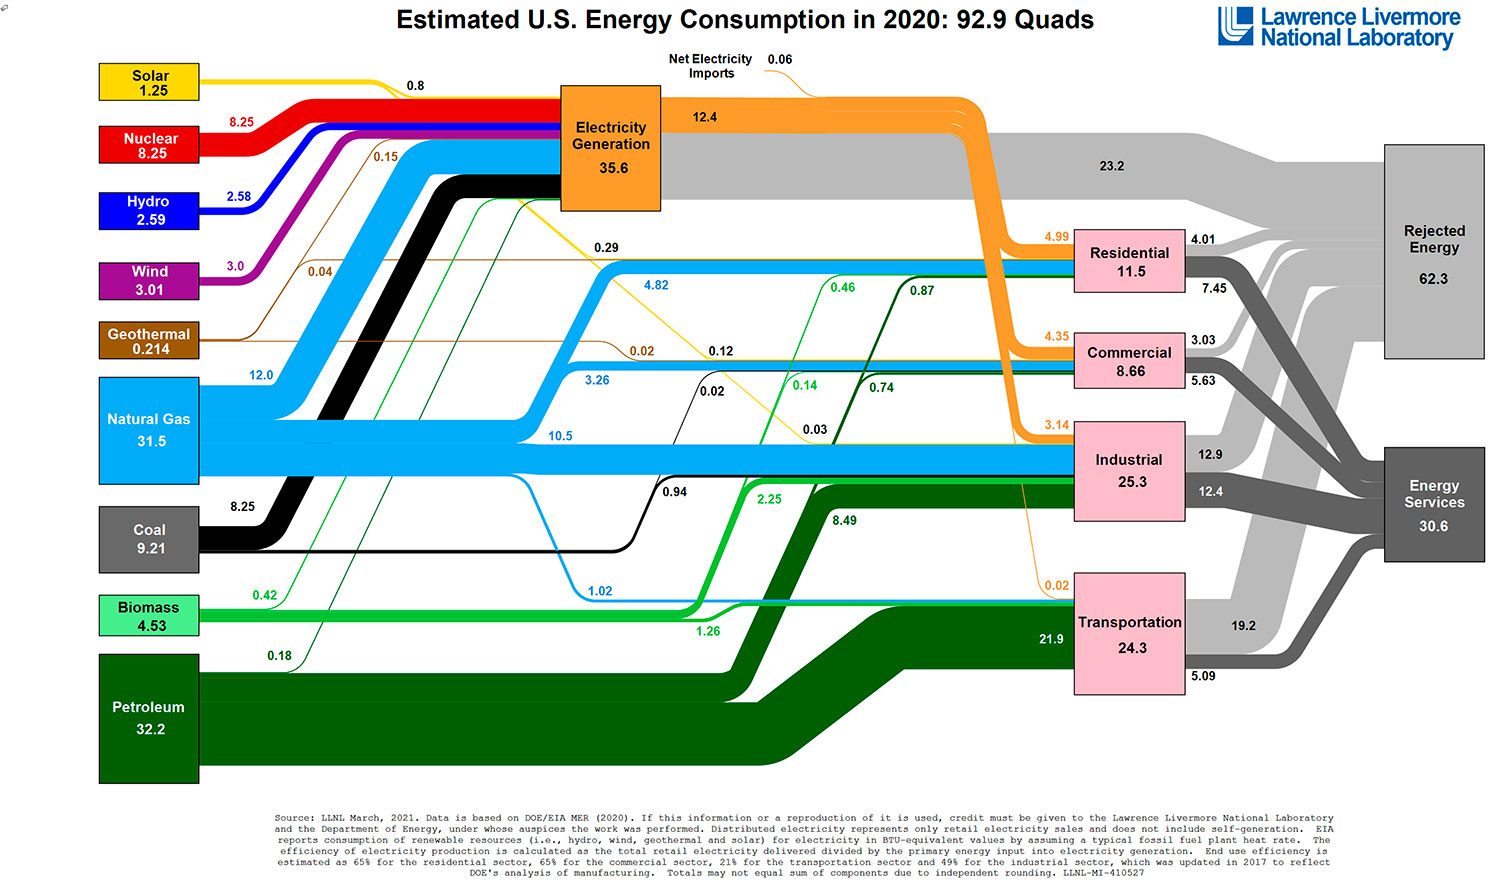
For the next three months
total energy use across all sectors... transportation, industrial,
commercial, and residential... plummeted by over 15% thereafter
rising slowly in bursts and spats.

As an avid studier of all things "climate change" related I tracked
the impact this significant fuel use reduction had on the Keeling
Curve.
The
Keeling Curve is the chart
tracking carbon dioxide in the atmosphere based on near daily
measurements at the
Mauna Loa observatory located on
the big island of Hawaii.
The effect was both shocking and predictable.
The marked reduction of
fossil fuel use had no effect on the Keeling Curve which
continued its virtual 45% upward slope on the highly exaggerated
chart expressed as parts per million per year.
This was wholly
consistent with our findings over the previous 10 years as
developing countries increased fossil use with no corresponding
change of CO2 as reflected in this curve..
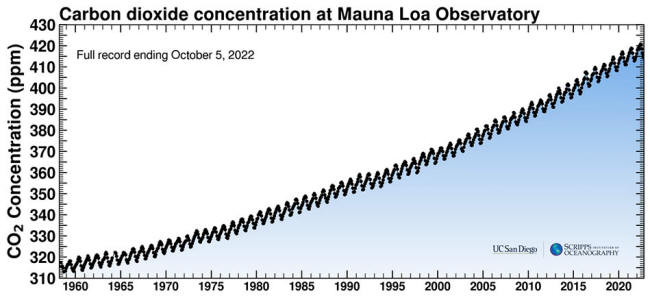
Notice on the upward slopping blue bar line of the Keeling curve in
figure 2, the jagged "sawtooth" line.
This jagged sawtooth
waveform represents the seasonal variations of CO2 as
affected by plant growth on land and sea.
This is a function of
the Earth's elliptical orbit around the Sun and its 23.5 degree
axial tilt...
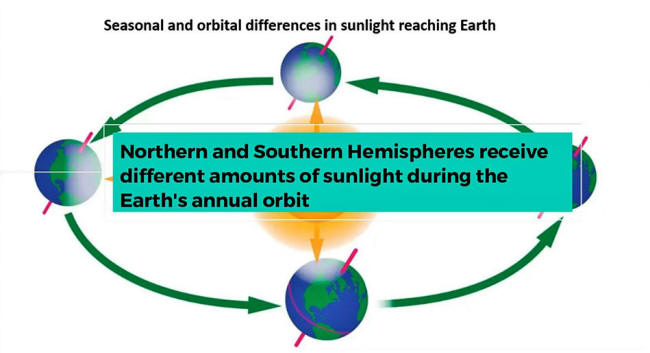
Close inspection of this saw tooth like variance in CO2
shows roughly 10 parts per million (ppm) variation between the
minimum and maximum as affected by sunlight and plant life
distribution.
This is far more than the
3 ppm increase in CO2 that the climate alarmist's
community claim is caused by man's use of fossil fuels.
To me, this was the
"smoking gun" showing that these claims of fossil fuel increasing
total CO2 were false and without merit!
In collaboration with,
Mr. Bud Bromley,
and with the kind financial support of actor/singer Pat Boone,
we engaged two Stanford educated PhD's, Dr. Shahar Ben-Menahem
a physicists and Dr. Abraham Ishihara, a high-level
mathematician and control theory expert,
...to design an
experiment using the Mauna Loa Keeling data which is
considered by all leading scientists as the "gold standard" of the
available CO2 monitoring data sets.
-
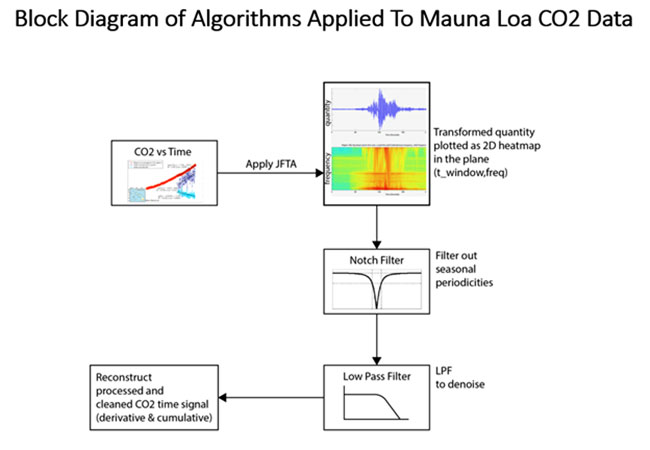
Our scientists
took the raw NOAA Mauna Loa data for daily CO2
tests and filled in data points for days with missing data
using standard interpolation methods.
-
Then they
transformed the CO2 ppm concentration versus time
data into the frequency domain, like a continuous spectrum
of light or radio frequencies. This provides nearly
unlimited resolution.
-
Then they notch
filtered to remove resonances and seasonal cycles such as
the shark's teeth.
-
Then they low
pass filtered out all frequencies above a specified
frequency to remove random noise spikes.
-
Then they
reconstructed the data again as CO2 ppm
concentration versus time and cleaned the CO2
time signal.
-
They calculated
these data as the time derivative of CO2
concentration. This is the rate of change of CO2
ppm concentration. It is like the speed or velocity of a
car.
-
Then they drilled
into these data to look at the time window beginning about a
year before the Pinatubo volcano eruption of June 15, 1991
and a few years after the eruption.
What we proved was that:
-
The NOAA-Scripps
"Keeling curve" dataset from Mauna Loa is responsive to CO2
changes even though the event causing those changes is
physically remote, thousands of miles away from the NOAA
measurement site on Mauna Loa in Hawaii.
We now know this
NOAA data will be sufficient for further data science.
Confirming this was one of the primary purposes of our first
phase of work.
-
Our results
confirm that human CO2 emissions are
insignificant compared to net global average CO2
concentration.
We demonstrate
this by simple calculations in our written publication of
the results of this Pinatubo study and in 2 addenda.
-
The software and
method we used is sensitive to changes in the CO2
daily records from Mauna Loa and well suited for further
research.
-
The result of
this first phase of our study is consistent with Henry's Law
in conjunction with the Law of Mass Action, Le Chatelier's
Principle, Graham's Law and Fick's Law.
CO2
concentrations in air, ocean, soil, and biosphere began to
rapidly re-equilibrate to the cooler Earth surface caused by
reduced insolation due to the cloud belt.
As the cloud belt
dissipated and surface warmed, CO2 concentrations
rapidly re-equilibrated.
-
Following Henry's
Law, human-produced CO2 can only temporarily
change CO2 concentration in air and ocean
surface.
Our results,
confirming NOAA-Scripps results, suggest that human CO2
emissions are a temporary perturbation to an ongoing CO2
trend, like the perturbation caused by the Pinatubo volcanic
eruption and its aftermath, but much smaller.
Perturbation by
human emissions will be rapidly returned to the CO2
trend.
CO2
concentration in air is controlled by CO2
solubility in water surface.
More than 90% of
Earth's water is in the ocean, and ocean is 70% of earth's
surface.
-
Solubility of any
gas in any liquid is an intensive property of matter, like a
boiling point, or a specific heat. Intensive properties of
matter are not a function of the amount of material present.
Instead,
solubility and diffusivity of a gas in a liquid are a
property of the matter itself; in this case, diffusivity of
CO2 is a function of the molecular weight of CO2.
Adding more CO2
to the air, whether done by a volcano or by humans, or by
decaying biological material, does not change the ratio of
CO2 gas concentration in ocean surface versus CO2
gas concentration in air above that surface, this is Henry's
Law.
Surface
temperature does change that ratio.
-
Solubility or
diffusivity of a gas in a liquid depends on the surface
temperature and the molecular weight of the gas, not on the
amount of the gas or the source of the gas.
Diffusivity of a
gas in a liquid is inversely proportional to the square root
of the molecular weight of the gas; this is Graham's Law.
-
There are many
variables that affect surface temperature, some are
systematic like Earth's orbital distance from the sun, and
other variables may be chaotic, such as ocean and air
currents, storms, humidity and clouds.
The bottom-line results
of our experiment and analysis of the NOAA Scrips Keeling
data conclusively PROVES that,
"the net amount of
equilibrated carbon dioxide (CO2) in the atmosphere
is the same as if human beings never existed."
Climate Change is a natural
phenomenon, and not manmade...
Let that sink in.
The total net amount
of CO2 in our atmosphere today is no more or no less
than if humans never existed on our planet...
Why does the keeling
curve show an increase of roughly 3 ppm per year?
Because of slight
increases in sea surface temperatures resulting from perturbations
in the Earth-Sun orbit and changes in the gravitational pull between
the earth and large planets which also slightly affect sea surface
temperature.
And yet only today the New York Times writes Hurricane Ian,
"rapidly transformed
from a relatively weak storm into a strong one, a phenomenon
that has become more common due to climate change.
Ian embodies several
of the major hurricane trends in recent years, as the world
copes with the effects of climate change."
Indeed, Ian was
devastating, but well within the bounds of natural variability.
Two days ago,
the Vatican released a new
documentary on climate change based on what it calls the,
"reckless new use of
fossil fuels" through
Cardinal
Czerny, and calls for "zero emissions" by 2050.
Only a few weeks ago,
Congresswomen Rashida Tlaib tried to browbeat the nation's
largest bank CEOs into not lending to oil and gas companies.
Thankfully, and
correctly, JP Morgan Chase's CEO, Jamie Dimon, responded to
the Congresswomen when asked if Chase would cease lending to energy
companies as follows:
"Absolutely not and
that would be the road to hell for America."
In a recent private
exchange with Dr. Richard S. Lindzen, Professor Emeritus,
Alfred P. Sloan Professor of Meteorology, Massachusetts Institute of
Technology and author of over 200 scientific papers and books on
the atmosphere, I pointed out that the climate change farce
drivers are purely and totally financial and political.
The science is clearly on
our side. Of course I was preaching to the Choir...
Dr. Lindzen points out:
"...the importance in
propaganda of establishing the narrative (i.e., the accepted
story line).
One of the more
subtle techniques is to pepper the narrative (climate change is
'caused by man'...) with many obviously dubious features.
This may seem counter
intuitive. However, by doing so, one diverts attention from the
narrative's larger framework.
People immediately
attack these dubious features while leaving the larger narrative
untouched."
He offers us this sage
advice:
"Stop treating AGW...
human-caused global warming/climate change... as a worthy
opponent. Do not ascribe reasonableness to the other side.
It is not reasonable,
not true, and not even plausible."
This message and these
facts must be brought to the people.
Only then can the
political establishment be jarred into reality. Perhaps we should
start with religious leaders in the Christian and Jewish community.
Thought provoking
articles about this subject and our study such as those published
this week by the Times of Israel by Israeli-American Rabbi
Avraham Schwartz pave the way.
Please go to
pinatubostudy.com for a complete
glossary of all technical terms used herein, and links to all the
references as well as bios on our team.
The complete scientific
paper concerning our study along with a video lecture by Bud
Bromley introduced by me with my concluding remarks may also be
found there.
|