|

by Cap Allon
September
17, 2020
from
Electroverse Website

The global temperature record since 1880 is highly correlated to
solar activity, and in turn
solar activity is highly correlated
to the harmonics of planetary motion.
For you alarmists out there already rolling your eyes and thinking
the parroted nonsense you've read in The Guardian utterly
refutes this scientifically-sound reality, I urge you to objectively
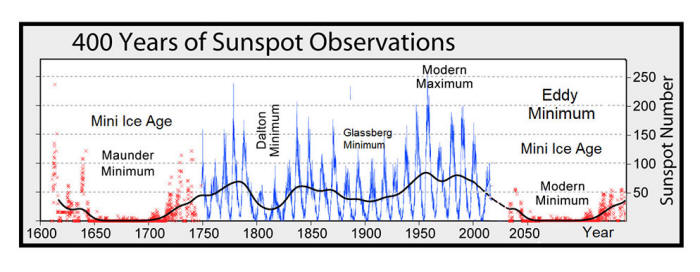
study this chart:

Historical Total Solar Irradiance Reconstruction,
Time
Series (climate.nasa.gov).
Note
the vertical line indicating the year 1880,
and
also note the Maunder Minimum (1645-1715)
and the
Dalton Minimum (1790-1830).
You
warmists couldn't have picked a
better starting point than 1880 (highlighted by the vertical gray
line).
That year - the
'supposed' beginning of the industrial revolution ('supposed'
because the revolution actually occurred between 1760 and 1840) - it
turns out received the lowest solar output since those of the Dalton
Minimum (1790-1830).
The NASA chart also
reveals Total Solar Irradiance (TSI) has been cumulatively building
since exactly 1880.
This 120+ years of solar
output became so active and so sunspot-productive that it was
designated as a Grand Solar MAXIMUM - the strongest maxima of the
past 4,000 years, and in turn - surprise-surprise - global average
temperatures rose with it.
Recently though (namely since the onset of
Solar Cycle 24), activity
on the sun has started to decrease, and although there is a complex
lag between changes in solar activity and global temps (ocean
thermal inertia being one likely cause), as eminent Russian space
scientist Habibullo Abdussamatov points out:
"(Nothing) will avert
the onset of the next deep temperature drop, the 19th in the
last 7500 years, which without fail follows after natural
warming."
This cherry-picked
starting point of 1880 reminds me of the Arctic ice extent debacle.
Those charged with
pushing
the 'global warming' narrative (NOAA, NASA, and the IPCC)
chose the year 1979 to begin their referencing. This was a
deliberate choice, and the fact that it coincided with the start of
satellite era is a coincidence, an excuse.
We have reliable polar
ice extent data going back to the 1920s at least (much further if
you include ice cores, of course).
What this historical data crucially reveals is that, like with every
aspect of our planet's climate, events and phenomenon are always
cyclic, never linear.
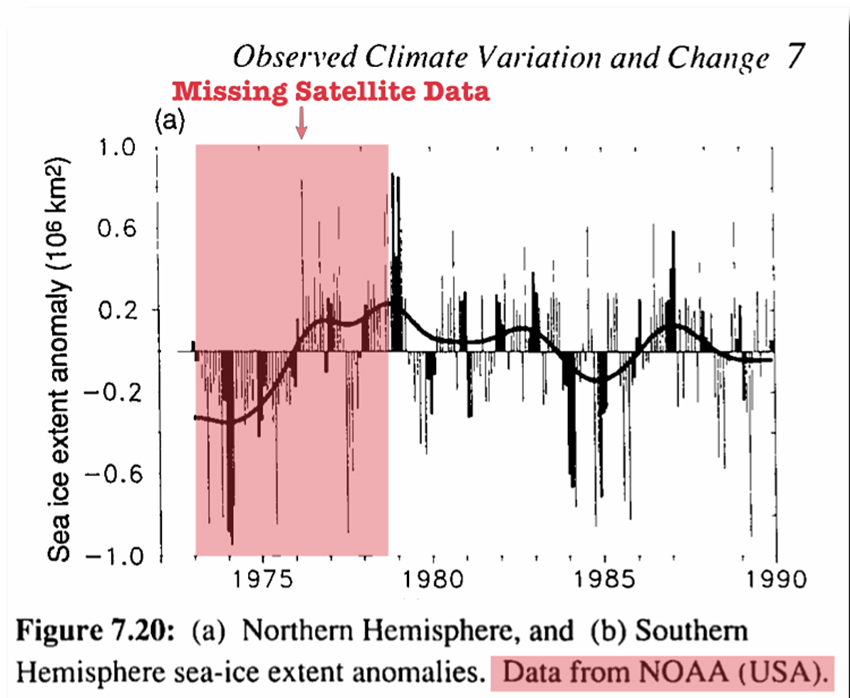
And more to the point,
these charts show that northern hemisphere sea ice extent was at an
historically high level in 1979 and just five years prior had been
at historically low levels.

The ebbing-&-flowing and melting-&-refreezing of the Arctic is even
clearer in the 'Vinnikov' chart below.
In addition, again note
the historically high point of 'sea ice amount' NOAA begin their
modern-day charts with.

This government
obfuscation smacks you in the face, so hard it would appear that a
lot of the population has been blinded.
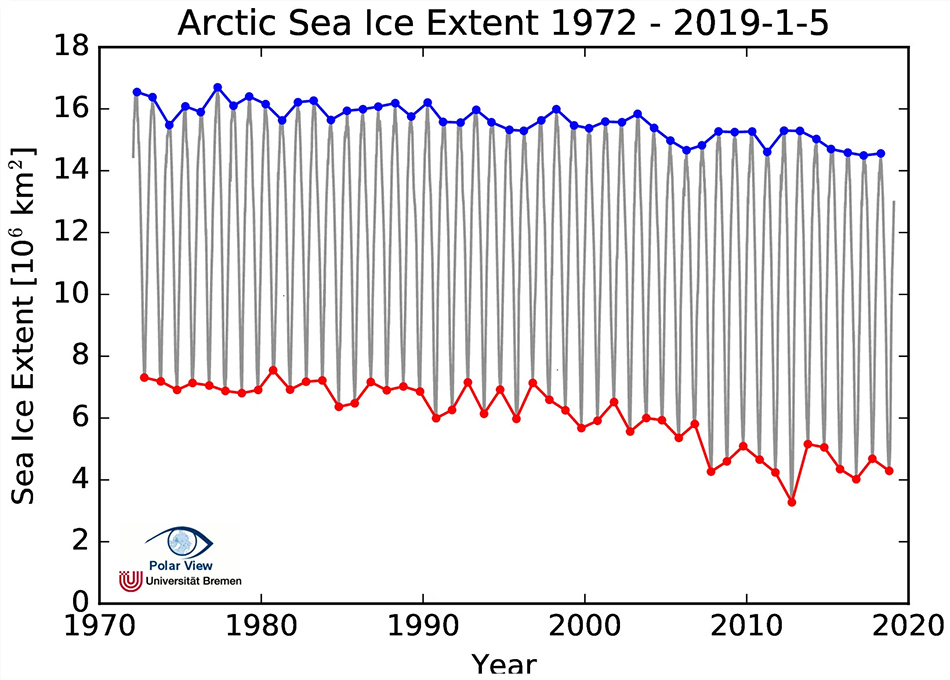
However, this is worse
than mere obfuscation, this is outright fraud; because although
these old records still exists, available for anyone to google, NOAA
have replaced them with fake data which now shows an utterly
unexplainable decrease in Arctic sea ice during the 1970s:

This outright fraud is being used as part of a dangerous ideological
reshaping of our world, one driven by the whim of a handful
of
powerful elites.
'Questioning
everything'
The above mentioned correlations and accumulating evidence of an
amplified solar effect on Earth's climate (and an expanded article
here) reveals a "unified theory" of
climate change, whereby gravitational effects from planetary motions
cause small changes in solar activity, which are then amplified via
cosmic rays/clouds (Svensmark's theory of
Cosmoclimatology - A New Theory Emerges), ozone, and
ocean oscillations to cause large changes in Earth's climate.

Global temperature anomaly (Blue)
vs.
signal of planetary modulation of solar activity (Red).
We humans have NO say in this multimillennial will of the cosmos, so
don't fall for any bogus political agendas - not least because of
the stark climate reality that is actually fast-barreling towards
us:
the
COLD TIMES are returning, the
mid-latitudes are REFREEZING, in line with historically low
solar activity, cloud-nucleating Cosmic Rays, and a meridional
jet stream flow.
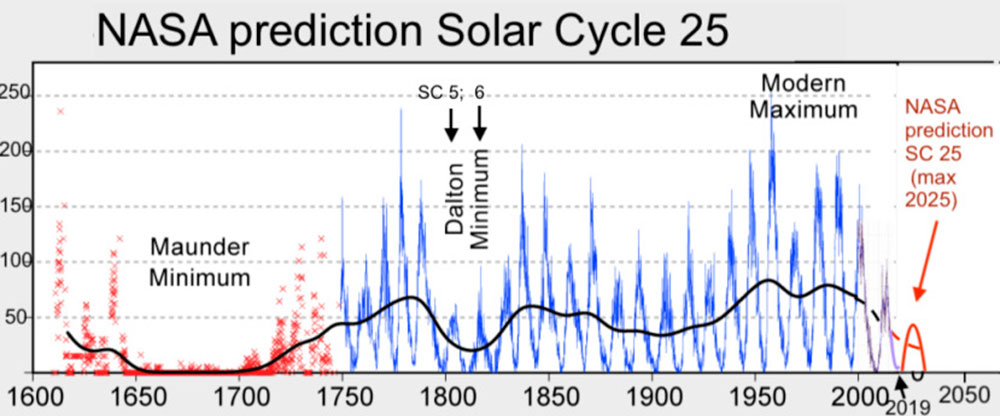
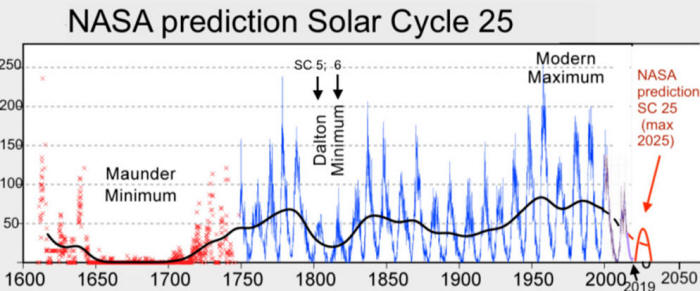
Both NOAA and NASA appear
to agree, if you read between the lines, with NOAA saying,
we're
entering a 'full-blown' Grand Solar Minimum in the late-2020s, and
NASA seeing this upcoming
solar cycle 25 "the weakest of the
past 200 years",
...with the agency
correlating previous solar shutdowns to prolonged periods of global
cooling here.
Prepare for the COLD - learn the facts, relocate if need be, and
grow your own.
|