|

by David Wilcock
2002
from PleiadianLightWork Website
THE CHANGES OF THE HELIOSPHERE
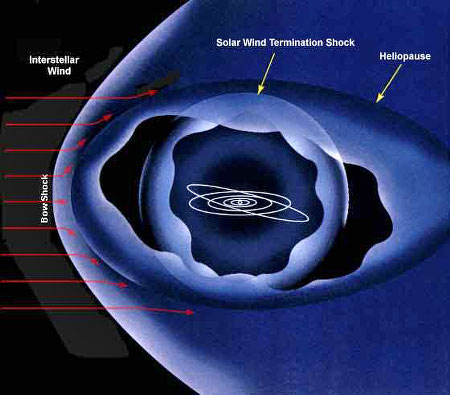
Figure 8.1 – The Basic Structure of the Heliosphere (Courtesy NASA)
-
Devastating earthquakes, 400% more frequent just since 1973.
[22]
-
Volcanoes
belching dust, smoke and lava, 500% more than in 1875. [22]
-
Tornadoes in
unexpected areas such as Maryland, 200% more frequent than 50 years ago.
[15]
-
Unprecedented mega-hurricanes sweeping across coastlines.
[15]
-
Blistering heatwaves, and winters without snow.
-
Wildfires raging across
continents.
-
Crippling droughts and/or unprecedented floodings.
-
Ever-climbing numbers of mass species extinctions.
-
Massive heatings in the
Atlantic and Pacific oceans. [3]
-
Gigantic chunks of ice falling off of the
polar icecaps.
-
Solar activity so energetic that many satellites were not
built to withstand the sudden increases, shattering all previous
expectations. [15]
-
Catastrophic Earth changes, such as earthquake and
tornado activity, emerging within days of major solar events. [15, 31]
These are the events of our daily lives, and once they arrive in our
backyards, we are forced to pay attention. The womb of the sofa, television
and remote control provides no haven when the ground is shaking, the grass
is scorching, ferocious winds are whipping, the seas are empty of fish, and
food crops wither within weeks as the rivers run dry.
The phenomenon of “synchronicity” has again occurred just two nights before
we post the entire Part One of this book online for the public, on Tuesday,
June 04, 2002.
As posted on the
Drudge Report
[46], then later in the
mainstream press [45], suddenly it’s official: the US government says
“global warming” is real.
In a stunning U-turn for the Bush
administration, the United States has sent a climate report to the
United Nations detailing “specific and far-reaching effects” that it
says “global warming will inflict” on the American environment… Also for
the first time – the White House places “most of the blame for recent
global warming on human actions – mainly the burning of fossil fuels
that send heat-trapping greenhouse gases into the atmosphere,” the NEW
YORK TIMES is planning to report on Monday Page Ones, according to
publishing sources…
The United States will be substantially changed in the next few decades,
claims the Bush report. The United States will “very likely” be seeing the
“disruption of snow-fed water supplies, more stifling heat waves and the
permanent disappearance of Rocky Mountain meadows and coastal marshes… The
new report’s predictions present a sharp contrast to the administration’s
previous statements on climate change, in which President Bush always spoke
in generalities and stressed the need for much more research to resolve
scientific questions.”
Despite these often-discussed changes, only a very small number of people,
mostly Russian scientists, are aware that the entire Solar
System (heliosphere) is experiencing these changes. [15]
“Global warming”
from CFCs and fossil fuel usage is actually only a minor player in the
changes that are now occurring. This chapter of our book will present the
case for the energetic transformation of the Solar System in a form never
before seen worldwide, prior to the exact day that the US government came
clean.
The burning desire for an answer has produced many conflicting ideas about
what is causing these ever-increasing changes. Outside of government
admissions of “global warming,” the theories that have propagated in the
Internet metaphysical subculture do not require much scientific
substantiation, simply a general feeling of impending doom coupled with a
great degree of faith. As one popular example, a relatively uncommon
planetary alignment on May 5, 2000 was heavily hyped up as being the
trigger-point for Earth crustal displacement / pole shift, “the ultimate
disaster.”
Asteroids are said to be about to strike the Earth. And more
recently, legitimate research by
Zecharia Sitchin has been combined with
intuitively “channeled” speculation that the missing planet
Nibiru is about
to make a close pass to Earth in 2003. This mythical scenario has been used
as a catch-all to explain away the changes we now experience.
Dr. Sitchin himself has calculated that the planet Nibiru shall not return
until some time after 2160 AD. [47] One would expect that such a massive
object enjoying an established 3,600-year orbit would now be glaringly
visible, with less than a year before it screams into our lives, larger than
the Moon in the night sky. Yet, no observational evidence exists, only
shadowy rumors of conspiracy and “leaks” from nameless “informants” in the
astrophysics community.
Furthermore, a naturally-orbiting planet would
certainly not be capable of causing such massive energetic surges throughout
the entire heliosphere, which is the combined entity of the Sun’s massive
magnetic field and all orbiting bodies within it. Indeed, an outside source
of energy is required to explain the anomalies that we are now witnessing.
However, most people who already believe in Nibiru 2003 will probably not be
open to alternative perspectives until some time after the popping of
champagne corks and a collective sigh of relief on Jan. 1, 2004.
In this chapter, we will make the strongest single case ever that our Solar
System (heliosphere) is moving into an area of higher aetheric energy
density within the local interstellar medium, or LISM. [15]
NASA would
loosely define the LISM as “the space medium (i.e.
aetheric energy in this
model) between the stars in our local area of the galaxy.” In our model,
this could be roughly thought of as a “Dimensional Shift” that is already
underway, though the term “matter-energy density shift” is preferable.
As we
move into this new field of energy in the galaxy, tremendous changes occur
in the Sun, the planets and the Sun’s gigantic magnetic field which
surrounds the entire system – and human pollution-induced “Global Warming”
has very little influence on this process.
[This new model has major
differences from the channeled “Photon Belt” theory as well, and should not
be seen as supporting most aspects of it, such as the “Manasic Ring.”]
THE BREAKTHROUGHS OF DR. ALESKEY DMITRIEV
A good portion of the material in this chapter was gleaned from the work by
Dr. Aleskey Dmitriev entitled
Planetophysical State of the Earth and Life,
which was originally authored in 1997 and updated and translated into
English in 1998. [15]
Dr. Dmitriev is a professor of geology and mineralogy
and the chief scientific member of the United Institute of Geology,
Geophysics and Mineralogy within the Siberian department of the Russian
Academy of Sciences. Dmitriev is an expert on global ecology and
fast-processing Earth events, and a series of his articles have been
translated into English and posted at
The
Millenium Group. Much of the material
in this chapter is also similar in its sequence and factual content to our
Friday night science presentation in the Time of Global Shift National
Seminar Tour. [44]
Dmitriev’s study begins by pointing out that the now government-acknowledged
changes in the basic physics and behaviors of the Earth are becoming
irreversible. Strong evidence suggests that these changes are caused by our
movement into what Dmitriev calls “a highly charged material and energetic
non-uniformity”, or what we would refer to as a higher density of aetheric
energy, in nearby (local) interstellar space (the LISM).
This previously
unforeseen, highly charged energetic material is now being absorbed into the
interplanetary area of our Solar System, creating “hybrid processes and
excited energy states in all planets, as well as the Sun.” The observable
effects of this transformation on Earth include an acceleration in our
magnetic pole shift, a change in the vertical and horizontal content and
distribution of ozone in the atmosphere and an ever-increasing magnitude and
frequency of major catastrophic events. [15]
One important point that Dmitriev stresses is that this is not just his own
hypothesis:
A greater number of specialists in climatology, geophysics, planetophysics
and heliophysics are tending towards a cosmic causative sequence version for
what is happening. Indeed, events of the last decade give strong evidence of
unusually significant heliospheric and planetophysical transformations.
[emphasis added]
Furthermore, Dmitriev acknowledges that the changes we have observed are
forcing a completely different and more highly integrated view of the Cosmos
to the discussion table.
In this new model,
The climatic and biosphere processes here on
Earth (through a tightly
connected feedback system) are directly impacted by, and linked back to, the
general overall transformational processes taking place in our Solar System.
We must begin to organize our attention and thinking to understand that
climatic changes on Earth are only one part, or link, in a whole chain of
events taking place in the Heliosphere. [emphasis added]
The case for such an energetic interconnectedness has already been well
established in our previous chapters. Another important quote says that
“these tendencies [of rapid catastrophic changes on Earth] may be traced in
the direction of a growth in planetary energy capacity (capacitance), which
leads to a highly excited or charged state in some of Earth’s systems.”
In
the aetheric cosmology that we have presented so far in this book, any
spherical vortex of aether, such as the Earth’s luminous plasma core, is
capable of absorbing and discharging energy much like a capacitor would do
in an electronic circuit. As established in previous chapters, luminous
plasma has strong electromagnetic as well as torsion-field (gravispin)
radiation.
Dmitriev concludes that “the most intense transformations [in the Solar
System] are taking place in the planetary gas-plasma envelopes,” and that
these transformations are directly associated with how life on Earth (the
biosphere) is able to function. A “gas-plasma envelope” is the combined
entity of the layers of our atmosphere, our ionosphere of “charged
particles”, and the planet’s magnetic field composition, such as the
Van
Allen belts.
This “excess energy run-off” is becoming increasingly visible
in the following ways:
-
In the ionosphere by
plasma generation
-
In the magnetosphere by magnetic storms
-
In the
atmosphere by cyclones
All of these high-energy atmospheric phenomena are “now becoming more
frequent, intense and changed in [their] nature. The material composition of
the gas-plasma envelope is also being transformed.” All of these points will
be touched upon again later in the chapter.
One of Dmitriev’s key concerns in this study is the effect that these
changes will have on all lifeforms on the Earth.
Using very carefully
crafted language, Dmitriev ultimately shows an appreciation for the fact
that these changes could lead to a spontaneous mass evolution of humanity as
we now know it, creating “new and deeper qualities of life” with “new organismic possibilities of perfection”:
The adaptive responses of the biosphere, and
humanity, to these new
conditions may lead to a total global revision of the range of species and
life on Earth. New and deeper qualities of life itself may come forth,
bringing the new physical state of the Earth into an equilibrium with the
new organismic possibilities of development, reproduction and perfection…
The current period of transformation is transient, and the transition of
life’s representatives to the future may take place only after a deep
evaluation of what it will take to comply with these new Earthly biospheric
conditions … Therefore, it is not only the climate that is becoming new, but
we as human beings are experiencing a global change in the vital processes
of living organisms, or life itself; which is yet another link in the total
process. We cannot treat such things separately or individually.
Part Two of this book will deal specifically with the connection between
aetheric energy, consciousness and biology, which will help us understand
the truth behind Dmitriev’s words. We will establish that the changes we are
now witnessing are identical to previous phases of mass evolution of
conscious lifeforms on Earth, as per Steven Jay Gould’s theory of
“punctuated equilibrium.”
These energetic changes do directly affect the
structure of the DNA molecule.
CHANGES IN THE LOCAL INTERSTELLAR MEDIUM (LISM)
A variety of Russian scientists have concluded that we are moving into a
higher area of aetheric density in the LISM, which is the single most
important factor that is responsible for the observed Solar System changes
in this model. As seen from the Earth, our Heliosphere is traveling in the
direction of the Solar Apex in the constellation Hercules.
According to Dmitriev in 1997, Dmitriev & Mahatmas in 1995 and
Kruzhevskii, Petrov &
Shestopalov in 1993, since the 1960’s the Heliosphere has drifted into an
area of the LISM that contains:
…[new] non-homogeneities [i.e. higher concentrations] of matter and energy
containing ions [charged particles] of Hydrogen,
Helium and Hydroxyl in
addition to other elements and combinations. This kind of interstellar space
dispersed plasma is presented by magnetized strip structures and striations.
Western scientists may innately distrust the idea that there could be
“magnetized strip structures and striations” in the LISM that would contain
such charged particles. However, in this aetheric model we expect to see the
same structures appearing on all levels of size. Figure 7.1 showed the
Parker Spiral formation as it appears in our Solar System, and by the
fractal principle there must be a similar formation in the galaxy.
Figure
8.1 shows an overhead view of the Parker Spiral in the Solar System, with
concentric circles indicating the positions of the planetary orbits:
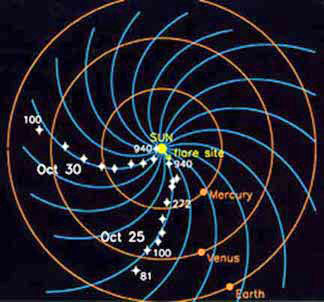
Figure 8.2 – Overhead view of Parker Spiral energetic structure in Solar
System. (Courtesy NASA)
Each curving arm of the Parker Spiral that we see in Figure 8.2 does indeed
represent a “magnetized strip” or “striation”, where there is a detectable
increase in magnetic energy and charged plasma as our planet moves through
it. Dmitriev’s evidence, as well as our own, clearly indicates that this
structure must also exist at the galactic level, by virtue of the fractal,
harmonic interconnectedness of the Cosmos.
From here, Dmitriev’s quote
continues:
The Heliosphere [solar system] transition through this structure has led to
an increase of the shock wave in front of the Solar System from 3 to 4 AU,
to 40 AU or more [1000% increase.]
The “shock wave” that Dmitriev is referring to here is what is known as the
“termination shock,” and we can see it illustrated in Figure 8.3:
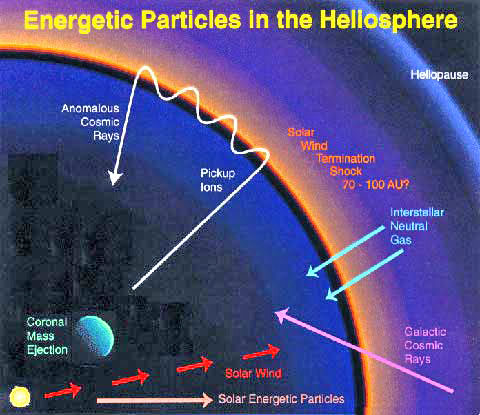
Figure 8.3 – Energetic activity of the Heliosphere, showing 70-100 AU
termination shock.
One can assume from Dmitriev’s wording that this termination shock of
luminous plasma was measured at 4AU [i.e. four times the distance from the
Sun to the Earth] by Russian astrophysicists in the early 1960s, and once
the hydrogen, helium, hydroxyl and other charged particle combinations
became more prevalent later in the 1960s, the size and brightness of the
termination shock also increased, now by a factor of over 1000 percent.
Similar research did not begin in the United States until 1978, according to
Prof. D.E. Shemansky, [35] so Russian scientists had this information well
in advance of NASA. Obviously, this extra brightness at the leading edge of
the heliosphere is created much in the same way that the bottom of the Space
Shuttle or a meteorite will become red-hot as it drifts from the low-density
vacuum of space into the higher-density atmosphere of the Earth.
In more technical terms, Dmitriev goes on to explain what this 1000-percent
or higher increase in the excitation of this magnetic boundary really means:
This shock wave thickening has caused the formation of a collusive plasma in
a parietal layer, which has led to a plasma overdraft around the Solar
System, and then to its breakthrough into interplanetary domains [5,6]. This
breakthrough constitutes a kind of matter and energy donation made by
interplanetary space to our Solar System.
What this passage is essentially telling us is that a
new layer of luminous
plasma has been formed that surrounds the Solar System and is now flowing
into the Sun, planets and interplanetary space,
raising the overall levels
of energetic activity that we have observed. Subsequent sections of this
chapter will detail the specifics of this energetic change.
However, before
we begin surveying the surrounding evidence, it is interesting to research
the big question on many Western readers’ minds:
“If this is really happening, then why hasn’t
NASA ever talked about it?”
As we shall see, according to one distinguished Ph.D.,
[35] NASA seems to
have a “persistent, pernicious bias” against any discussion of this heliospheric change, and will automatically assume, without question, that
the LISM must maintain a “uniform density.” Other, more esoteric-sounding
explanations are proposed for the observed luminosity and energetic
increases, such as “re-accelerated solar wind,” that do not have the
simplicity and elegance of Dmitriev et al’s model.
One rare exception to the rule of “unchanging LISM density” that we found
was in a 1999 interview with Gary P. Zank at the University of Delaware.
[42]
In this interview, Dr. Zank proposes that if the LISM density were to
change, then catastrophe might result, and we “may not know when it was
coming:”
“We’re surrounded by hot gas,” he said. “As our sun moves through extremely
‘empty’ or low-density interstellar space, the solar wind produces a
protective bubble – the heliosphere around our solar system, which allows
life to flourish on Earth. Unfortunately, we could bump into a small cloud
at any time, and we probably won’t see it coming. Without the heliosphere,
neutral hydrogen would interact with our atmosphere, possibly producing
catastrophic climate changes, while our exposure to deadly cosmic radiation
in the form of very high-energy cosmic rays would increase.”
Zank used the SDSC CRAY T90 in a study of the heliosphere, the envelope of
solar wind that surrounds the solar system. Two effects included in the
simulation ensure that the interaction of the solar wind with the local
interstellar medium (LISM) is not stationary.
The solar wind ram pressure
varies on an 11-year time scale, and strong shocks are present during all
phases of the solar cycle (although their frequency can vary)… Zank’s
calculations suggest that existing instruments might not detect an increase
in the LISM sufficient to compress or collapse the heliosphere before the
actual interaction had begun. [emphasis added]
Dr. Zank believes that we may encounter a random cloud of higher energy
density in the LISM, whereas the galactic Parker Spiral model seems more
plausible, since the same energetic structure has already been proven to
exist in the Solar System. One key confession that we can glean from
Dr. Zank’s advanced research is that our existing instruments are not sensitive
enough to detect a significant increase in the LISM density before we
actually enter it. Therefore, it seems rather foolish for most Western
heliophysicists to assume that the LISM must maintain a uniform density, if
our instruments are not sophisticated enough to prove it.
More evidence to
support this point comes forth from the European Southern Observatory (ESO):
…unfortunately there are no direct ways to measure the
local interstellar
electron (or proton) density, nor the local interstellar magnetic field,
while these two parameters govern the structure and size of our heliosphere.
Therefore, there is a need for indirect observations which can bring
stringent constraints on the plasma density and the shape and size of
the interface to allow for the choice of an adequate theoretical model.
[16]
Despite the ESO’s stated need for “indirect observations” of the density of
the LISM, such as those reported by Dmitriev, it is almost always assumed
that the LISM must have an unchanging density for any “adequate theoretical
model.” [16]
Another example of “LISM density increase denial” would be in a paper by
R.A
Mewaldt from Caltech. [23] In the following quote, it is clearly
acknowledged that Voyager 1 and 2 have detected anomalous “enhancements in
the low-energy spectra” of the heliosphere.
However, an increase in the
density of the LISM is never mentioned as even a possible “seed population”
for these energetic enhancements:
Suggested seed populations include solar energetic particles (RSEPs),
re-accelerated solar wind (RSW), and ions energized by co-rotating
interaction regions. These re-accelerated components provide a possible
explanation for enhancements in the low-energy spectra of Mg, Si, S and
other elements observed by Voyager 1 & 2 beyond 60 AU (Stone and
Cummings
1997; Cummings and Stone 1999). There are also unexpected and unexplained
increases in the low-energy spectra of several elements reported at 1 AU
(e.g., Takashima et al. 1997; Klecker et al. 1998; Reames 1999).
So, from this study it is very clear to see that
Western heliophysicists
have indeed discovered “anomalous, unexpected and unexplained increases” in
the energetic activity at the termination shock of the heliosphere, as we
have expected from Dmitriev’s model.
Yet, instead of admitting that the LISM
density might have changed, they simply “consider new estimates of the
neutral populations of elements in the ISM”, among other complex and
problematic explanations that are only possible, not proven. No matter what
models for “re-accelerating” solar energy are proposed, the fact is that
energy must be conserved. The simplest explanation for the increase in the
heliosphere’s energetic charge is that it is being added by an outside
source.
One professor, Dr. D.E. Shemansky of the University of Southern California,
has dared to make a particularly bold statement about this problem,
suggesting that there is a deliberate effort in place by NASA to avoid any
discussion of his “first evidence” for a “large increase” in the energetic
density of the LISM [35]:
Research on the properties of the Local Interstellar
Medium have been
carried out in scattered periods beginning in 1978. The NASA Space Physics
Division has shown a persistent pernicious bias against work on the effects
of the neutral gas in the LISM in the United States, from the time of the
formation of the Division…
The most important contributions to research in
this program are papers (48), which presents a calibration independent
method of determining absolute LISM density, and (89), which presents the
first evidence for a large increase in the LISM neutral atomic hydrogen
density from Voyager measurements of the 50 AU region…
It is certainly interesting that Dr. Shemansky would say that
NASA has
displayed a “persistent, pernicious bias” against this work. The Microsoft
Word 2000 thesaurus indicates that the word “pernicious” is synonymous with
“destructive, harmful, deadly, evil” and “insidious.” So, the question must
be asked: Why would there be a “deadly” and “insidious” interest on the part
of NASA in not asking these crucial questions about an LISM density
increase?
The answer might well be found in the studies from Russia such as those of
Dr. Dmitriev, where it is well-established that this LISM density increase
is underway, and that it is causing massive energetic changes throughout our
entire heliosphere. These changes fit perfectly with worldwide ancient
prophecies, including those of the Judeo-Christian Bible, describing events
that would transpire in “end times,” or what other cultures referred to as
“the dawning of the Golden Age.” It is undeniable that the media ridicules
and ignores the UFO question, evidence of sunken ancient cities,
Martian
monuments and the like. [39]
The door has now opened a crack with the
admission of “Global Warming,” but the massive changes in the Sun and
planets are discarded footnotes.
Another clear area of suppression is in the
real meaning of “redshift,” which holds the key to giving us a complete
model to prove that changes in LISM density can and must
exist.
“REDSHIFT” ENERGY VALUES AND AETHERIC DENSITY LEVELS
Figure 8.4 – Dr. William Tifft’s “quantized” changes in “redshift” microwave
data.
Indeed, a complete mathematical model already exists that can be combined
with direct observational evidence to prove that galaxies must have regular,
organized changes in their LISM density levels. In the book Seeing Red, the
respected and controversial astrophysicist Dr. Halton Arp has shown
rigorous, voluminous evidence to prove that “redshift” has nothing to do
with the distance of a celestial object, as is currently believed. [30, 31,
37, 38]
Simply put, redshift is a measurement of how much of the microwave
spectrum of reflected starlight shines near the ‘red’ end of the ‘rainbow.’
Sir Edwin Hubble proposed a theory that seemed plausible at the time, since
it appeared that the farther an object was from the Earth, the higher its
redshift.
Arousing similar controversy, Dr. William Tifft has proven that
redshift is
“quantized,” meaning that it only occurs in certain regular harmonic
intervals, as seen in Figure 8.4. [1]
Another proof for Tifft’s discovery
can be seen in the graph of quasar data in Figure 8.5 [38]:
Figure 8.5 – Quantized values for ‘redshift’ in nearby quasars.
Clearly, if the wavelengths in Figure 8.5 were an indication of distance,
and all redshift values only fall into certain exact intervals with nothing
whatsoever in between, then it would imply that the Earth was the center of
the Universe.
All quasars in the Universe would naturally have to fall into
discrete “shells” of distance away from the Earth, as seen in Figure 8.6.
[38]
This places us right back into the medieval “geocentric” models of the
Universe!
Figure 8.6 – The Earth-centered Universe as seen from the mainstream
redshift theory. (Courtesy J Talbot)
Simple common-sense knowledge of our position in the Galaxy would tell us
that the Earth is not the center of the Universe; the major problem that we
then face is that redshift is the primary method that astrophysicists use to
calculate the distances of celestial objects. What we are faced with,
instead, is a very strange anomaly that screams of “harmonics”, the basic
vibratory patterns of sound in any given medium, which we would expect to
see in aetheric models of the Cosmos. [39]
For our next key point, let us not forget that the luminous plasma
formations observed by Dr. Erling Strand in Norway, (discussed in Chapter
Five,) would spontaneously appear and disappear from view, with a
temperature as hot as the Sun one second and no measurable temperature the
next. Yet, throughout this entire time, the plasma formations could still be
tracked on radar and / or in the infrared spectrum. We have concluded that
these plasma formations are oscillating between two major levels of aetheric
density, namely our own level and the level directly above our own. (Most
thinkers would erroneously call these density levels “dimensions.”) [39]
When the plasma moves (displaces) into the higher density, its visibility
and immense heat disappears, but it still emits higher-spectrum wavelengths
such as infrared and very probably microwave as well. Therefore, when we see
even, quantized harmonic values for all the microwave radiation that we
observe from distant celestial objects, it is certainly plausible that this
could be a sign of changing levels of aetheric energy density.
The final proof comes from Dr. Harold Aspden of Cambridge University, who
has indeed mathematically proven that the aether has varying levels of
density, creating what he calls “space domains.” [1]
He describes each
different level of interstellar medium (ISM) density as follows, and we have
paraphrased in brackets to ease comprehension:
One can say that… each [aetheric density level] corresponds to the number of
electrons and positrons that can be created as a group [after] an aether
particle [is annihilated] and the aether space thereby vacated [is then
filled up by the electrons and positrons]… there are many such different
domain regions in the whole expanse of the universe.
So, an “aether particle” is the same as what
Dr. Vladimir Ginzburg has
called a “field bubble” in Chapter Two. According to Aspden’s theory, the
denser the LISM will be, the smaller the “aether particles” will be in that
area, since they are under greater pressure. If an “aether particle” is then
annihilated, a sudden empty space is formed, and electrons (photons) and
positrons will rush into the empty space. The electrons (photons) and
positrons do not change in size, so less of them would fit into a smaller
space than would fit into a larger space.
Dr. Aspden’s data shows that only a certain exact number of positrons and
electrons can fit in such an empty space, once it has been created. For each
density, the number of particles that will fit in the empty “field bubble”
of space is known as “N,” and it has a maximum value of 1843, which is the
number for our own density.
The density above our own has an N of
1842, the
next has an N of 1841, and so on, since the field bubbles in each new
density are smaller than the previous density. As can be studied in more
detail on Aspden’s site, the mathematics behind this statement are quite
involved, but his data provides a perfect means to calculate formerly
unsolved mystery numbers in the quantum realm, such as the fine-structure
constant, (see Ch. 2-3 of this book,) at the “part-per-million level of
precision.” Furthermore, this work was deemed worthy of being published in
the prestigious Physics Letters A in 1972. [2]
Here’s the simplified punch line: when Dr. Aspden first saw Tifft’s
quantized redshift values, he realized that they were identical ( ! ) to the
values that corresponded to aetheric density levels in his model. [1] Yet,
when Aspden tried to publish a follow-up to his original 1972 paper in
Physics Letters A, complete with the direct observational evidence from
Dr. Tifft to prove that these areas of higher density exist now in the
Universe, the paper was anonymously rejected as “numerological” and all
further appeals failed – even though his new paper only added direct,
visible evidence to what had already been accepted and published in the same
journal in 1972.
The falsely rejected paper can still be read on
Aspden’s
website in Tutorial 10, complete with his rebuttals to their criticism. In
conclusion, Aspden makes the following interesting speculations:
As can be verified, the 72.5 km/s steps reported from astronomical
observation are in precise accordance with the theory under discussion… Such
domains [of aetheric energy density] have bearing on geological events such
as geomagnetic field reversals, [which occur] as the solar system transits
through boundaries separating adjacent space domains.
Naturally, this connection between aetheric density and
geological events is
exactly the same as the conclusions being made by Dmitriev et al, with
Aspden providing a solid, mathematical model that dramatically strengthens
the case.
Even more significantly, on page 764 of The Vital Vastness – Volume Two by
Richard Pasichnyk, we read the following:
High redshift is usually connected with features pointing to the youth of a
galaxy. Redshift is also a function of the positions in the systems, which
indicates strong intergalactic fields that influence redshifts. Likewise,
individual galaxies display redshift gradients from their inner to far
limits.[31]
Since we were obviously quite interested in this data point,
Pasichnyk
communicated to us that this “galactic redshift gradient” discovery was
actually published by astrophysics graduate students, since the mainstream
would never allow such work to get through. Nonetheless, further
observational research will undoubtedly only serve to confirm this data ever
more concretely than before. This effectively proves the existence of a
Parker Spiral-type formation of changing aetheric energy levels in the
Galaxy, as can be visualized in Figure 8.2.
Pasichnyk then continues by saying that the amount of redshift that is
emanating from the core of our own Milky Way Galaxy is of an almost
unimaginably massive strength, compared to any conventional explanations:
A redshift field is also found in the plane of the
Milky Way with what
conventional theory would call an “expansion” (Hubble constant) that is ten
times higher than the Universe as a whole.
With the Arp / Tifft / Asdpen model in place, this proves that
the Galactic
Center is by far the greatest source of aetheric / torsion-field energy in
the Galaxy, as we have already proposed in our own model, laid out in the
previous chapters.
Now that we know that these aetheric energy levels can and must exist in the
interstellar medium of our galaxy, and that there appears to be an ongoing,
quite deliberate effort to suppress this information by NASA,
Physics
Letters A and other mainstream Western sources, we are ready to continue
examining the direct physical proof of the changes that this event is
producing. Though much of this material comes from Dr. Dmitriev, we have
also added additional research data to strengthen the case even more.
The
Earth, the Sun, the planets and the space between the planets are all
showing major signs of energetic change as the higher-density energy of the LISM continues to stream into the heliosphere in greater and greater
concentrations.
ENERGETIC CHANGES OF THE EARTH
Figure 8.7 – Earthquake Activity over 2.5 on the Richter scale, 1973-1998
(Courtesy Michael Mandeville)
As the Bush administration now acknowledges publicly, it is evident that
“specific, far-reaching effects” are underway on Earth that will
“substantially change the United States in the next few decades.”
Going well
beyond the “global warming” content of the Bush administration’s report, we
know that our weather patterns have become increasingly chaotic, damaging
and unpredictable. We have hurricanes, typhoons, tornadoes, mudslides,
floods, droughts, and other catastrophes occurring on an ever-increasing
basis. As one example, the awesome mid-1990’s Hurricane Andrew was almost as
large as the entire state of Texas.
One could argue that the unchained force of nature is a far wider threat to
Americans than terrorism. Dr. Alexey Dmitriev’s calculations suggest that:
The dynamic growth of significant catastrophes shows a major increase in the
rate of production since 1973. And in general, the number of catastrophes
has grown by 410 percent between 1963 and 1993.[15]
Based on the surge in activity that has been seen since this study was made,
we can assume that a more updated statistic may now be as high as 600
percent. And again, this exhaustively-researched figure includes all forms
of catastrophe, including earthquakes, volcanic activity, tornadoes,
hurricanes, floods, droughts, et cetera. Yet, no mainstream source would
appear to be willing to make such a bold statement at this point, since
“global warming” is ruled out.
Along the same lines, a researcher named Michael Mandeville has clearly
shown that worldwide, the number of earthquakes over 2.5 on the Richter
scale have increased by as much as 400 percent since 1973, as seen in Figure
8.7. [22]
Furthermore, Figure 8.8 shows that volcanic activity has also seen
an almost 500-percent increase between 1875 and 1993. [22]
Figure 8.8 – Worldwide volcanic activity increases 1875-1993. (Courtesy
Michael Mandeville)
These statistics can also be examined farther back in time as well. Before
we had modern seismic equipment, the severity of an earthquake was measured
by the number of people who were killed. Based on this measurement scale, in
1999 the National Earthquake Information Center of Russia published a list
of the 21 most severe earthquakes in the world since 856 AD. Fully nine out
of the 21 biggest quakes since 856 AD were in the 20th century. [36]
This
study was mentioned by Dr. Sergey Smelyakov and will become a key aspect of
discussions in Part Two.
Now we must keep in mind how unusual all of these changes are, from a
conventional scientific standpoint, as they represent
“action-at-a-distance.” As we established in Chapter Five, we believe that
the primary cause for earthquake activity is energetic increases in the
core.
When these increases occur very rapidly, due to a sudden Solar
emission, some of the luminous plasma in the core is compressed into a
higher aetheric energy density level by the intense surrounding pressures.
Such a density shift allows the plasma to move freely through third-density
matter. This hyper-compressed plasma then bubbles up through the Earth’s
mantle, and once the pressure is relieved, it displaces back down into the
density of “physical matter.” A great explosive force is created as this
intense heat is then released in a much cooler area, and this would
certainly have an impact on geophysical activity, both for earthquakes and
volcanoes.
We remember from the beginning of this chapter that Dr. Dmitriev reports
that there are also changes occurring in our “planetary gas-plasma
envelopes” that are not being caused by human pollution. [15] New plasma is
being generated in the ionosphere, greater magnetic storms are appearing in
the magnetosphere, and cyclones are increasing in the
atmosphere.
Dmitriev
also indicated that “the material composition of the gas-plasma envelopes”
of the planets is also changing. More specifically, on Earth we have seen a
significant new growth of HO2 (hydroperoxyl) gas at an altitude of 11 miles,
which is completely inexplicable by any known source or mechanism, including
ozone depletion or human pollution via “global warming.” [15] A separate
Russian study confirmed that the total amount of cloud cover across the
globe has significantly increased just in the last century.
Additionally, ESO reported in 1994 that two new, unexpected populations of
cosmic particles have been discovered in the Van Allen radiation belts that
surround the earth [4]:
-
A new sheaf of electrons, greater than 50MeV in density, is now being
injected into the Earth’s inner magnetosphere during times of abrupt solar
magnetic storms known as Coronal Mass Ejections, or CMEs.
-
A new belt is emerging in the
Van Allen radiation bands around the Earth.
This new belt contains ionic elements that were traditionally
found only in
the composition of stars.
According to Dmitriev, these anomalies are directly being caused by a newly
changed quality of interplanetary space, which he feels is acting as a
transmission mechanism to allow the planets to interact with the Sun and
heliosphere to greater degrees than ever before. [In our model, based on
Kozyrev, Mishin, Shnoll [39] and other researchers’ discoveries, torsion
radiation will automatically provide such functions.]
Even more importantly,
This newly changed quality of interplanetary space… exerts stimulating and
programming action upon the Solar activity, both in its maximal and minimal
phases.
What Dmitriev is trying to tell us here is that this highly-charged energy
in the space between the planets has formed a two-way “circuit” that allows
events on Earth to affect the Sun, not just the other way around.
Returning to the Earth itself, another curious anomaly that we observe is
the phenomenon of La Niña or El Niño. On many weather satellite photographs,
such as in Figure 8.9, there is clear infrared data to show that a massive
sub-surface heating of the Earth’s oceans is now occurring:
Figure 8.9 – Massive sub-surface temperature anomalies in the Earth’s
oceans. (Courtesy NOAA)
Solar radiation is by no means strong enough to cause this heating, as these
temperature anomalies emerge deep beneath the surface of the oceans.
This
suggests that the oceans are being heated from within the earth itself. [3]
Furthermore, Dr. Dmitriev has shown that the strength of the Earth’s
magnetic field rises up and down in direct synchronization with these
temperature changes in the ocean. Furthermore, there is a 0.22 degrees C
change in worldwide temperatures over the course of 30 days that correlates
precisely with changes in the middle frequency of Earth’s magnetic field.
[15] Hence, the Earth’s core of luminous, magnetized plasma is directly
responsible for these changes. As the pressure of the plasma suddenly
increases, there is a surge in the strength of its magnetic field and a rise
in its thermal level, rising the ocean temperatures. Similarly, the
Novosibirsk Klyuchi Observatory in Russia has reported that the height of
the magnetic field is growing by up to 30 nanoteslas per year, again showing
changes in the core.
This increasing heat energy of the Earth’s core can also be seen in the
rapid melting of our polar icecaps.
The Ross Ice Shelf of Antarctica, which
is as large as the state of Rhode Island, fully broke off and dropped into
the ocean in the year 2000, as have several others in the last decade. This
process has greatly accelerated in speed throughout 2002, with three
gigantic chunks breaking away from the continent in only a few months of
time, the two most recent being named C-18 and C-19. This news is becoming
so prevalent that even the Bush Administration finally had to come forward
and admit that “something is happening.”
The magnetic poles have been rapidly shifting their positions as well,
leading up to what many authorities believe will be a complete shift in
their north-south orientation.
As frequently reported on the Art Bell
international radio program, our own Magnetic North is drifting away from
its normal position at an ever-increasing speed. This is occurring so fast
that airports all over the world are having to repaint their runways to
follow the Earth’s changing magnetic field, since airplanes must use
compasses to land. It has been suggested that this can also be seen in
significant changes to the navigational patterns drawn into airline flight
maps over just a ten-year period from 1990 to 2000, though we have not seen
this personally.
This magnetic change is also affecting the animal kingdom. Massive numbers
of marine animals have been anomalously beaching themselves, and many other
migratory animals, birds and fish are becoming confused and breaking their
normal migration patterns. Dramatic cases of mass bird deaths have also been
reported in the last few years, with no concrete explanations offered.
As
one example of avian migratory confusion, in 1999, radio talk show host Art
Bell and collaborator Linda Moulton Howe reported on two different homing
pigeon races that were conducted on the East Coast, where a completely
unprecedented number of the pigeons became hopelessly lost while traveling
along a well-known route, and never returned.
Furthermore, in Coming Earth Changes: The Evidence, Dr. William Hutton
reveals that Earth’s inner core not only rotates faster than the
outer core,
but it actually rotates at a different angle than the outside of the Earth.
[17] This certainly suggests that a shift in orientation has already
occurred on the inside of the Earth and will soon complete itself on the
outside as well.
Dr. Dmitriev and others remind us that as the Earth’s magnetic poles
continue to drift, they are traveling through a “magnetic pole shift
corridor,” which is a narrow strip that they have always followed in the
past prior to a complete magnetic pole reversal. Such reversals are not
unusual, as we know that the magnetic poles have continually flipped from
north to south in various lengths of time throughout history. In Figure 8.9
we can see the patterns, which were determined by analyzing the orientation
of magnetized iron molecules released in the lava from the undersea ridges.
As each new layer of lava cools along these ridges, the iron molecules
orient themselves to the position of the Earth’s magnetic poles at that
particular time.
Figure 8.10 – Earth’s Magnetic Pole Shift Corridors for past three major
shifts. (Courtesy Maurice Chatelain)
Furthermore, geologist
Gregg Braden shows that all the ingredients for a
magnetic polar reversal are now occurring again. [6]
The first ingredient is
that the strength of our gravitational field is extremely weak, in terms of
Earth’s overall history. With a grade of 10 being the strongest, we are now
very close to 1, at the bottom of the scale. Secondly, the strength of the
magnetic field is approximately 38% lower than it was 2,000 years ago, and
it is now measured to be decreasing at an average rate of about 6% per 100
years, according to Swedish scientist N.A. Morner in 1988.
Thirdly, the
earth’s electromagnetic energy vibrations, known as the
Schumann resonance,
appear to be rapidly increasing above the standard 7.8 cycles per second to
reported values of 8.6 or higher in certain areas. Every time that these
three ingredients have combined in Earth’s past history, says Braden,
a
magnetic pole shift has occurred.
So based on this idea, many researchers have concluded that it will cause a
tremendous cataclysm that will extinguish human civilization as we know it.
When our magnetic protection shield goes down, we will get a massive burst
of solar radiation that has historically been linked with mass extinctions.
It is important for us to state here that most people do not understand the metaphysical implications of this burst of new energy; in Part Two of this
book we will prove that it is directly associated with a spontaneous
transformation of matter, energy and consciousness.
SOLAR CHANGES
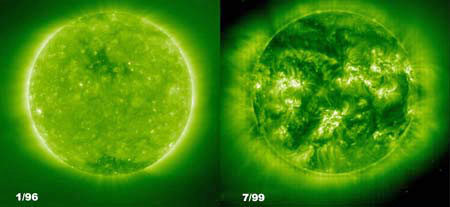
Figure 8.11 – Solar Activity at 1996 minimum (L) and 1999 maximum (R).
(Courtesy NASA)
When we turn our focus towards the Sun, we find similar anomalous increases
in overall energetic activity. A team at the Rutherford Appleton Laboratory
near Oxford, led by Dr. Mike Lockwood, has discovered that in the last
century, the overall strength of the Sun’s magnetic field has more than
doubled, becoming 230 percent stronger than it was in 1901. [20] Even more
interestingly, this rate of magnetic field growth is continually increasing
in speed.
Dr.
Alexey Dmitriev reports that:
As a whole, all of the reporting and observation facilities give evidence to
a growth in the velocity, quality, quantity and energetic power of our
Solar
System’s heliospheric properties. [emphasis added]
And let’s remember that the heliosphere is the magnetic field that emanates
from the Sun, surrounding our Solar System and beyond.
Every 11 years there is a major increase in the amount of Solar activity,
and we have again hit this solar maximum in the period of 2000-2002. In
Figure 8.11, which is tinted green for contrast, the difference between the
solar minimum of 1996 and the maximum of 1999 is quite obvious. Furthermore,
this current solar maximum has defeated all predictions for when it would
end; it continues to show high levels of activity in summer of 2002, though
it was originally expected to peak in 2000 and rapidly decline.
During the previous solar maximum in 1989, a very powerful X-ray flare on
March 5th led to the Sun emitting a stream of high-energy protons, which
flowed to the Earth continuously until March 13th. As reported by Chatelain
and Gilbert in The Mayan Prophecies, this event caused the
Earth’s magnetic
poles to deviate by a whopping eight degrees in only a few hours, which was
the most substantial sudden change in Earth’s magnetic field since 1952.
This event also caused serious disruption of communications systems, created
intense aurora borealis phenomena and completely collapsed the Canadian
power grid, with more than a million people losing their electricity for
several days.
Furthermore, Dr. Aleskey Dmitriev has correlated intense solar emissions
with Earth phenomena including severe weather such as hurricanes and
tornadoes, earthquake activity and volcanic activity on Earth. This same
information has been rigorously documented by Richard Pasichnyk in The Vital
Vastness book series and his
Living Cosmos website. [31]
Again, this
“action-at-a-distance” is caused by torsion radiation, whose effects were
scientifically proven by Dr. N.A. Kozyrev and others, as discussed starting
in the first chapter of this book.
Figure 8.12 – Surges in solar proton flux activity, 1997-1998. (Courtesy
NASA)
In 1995, NASA deployed the
Ulysses spacecraft out to orbit the Sun at high
altitudes and make specific readings.
To everyone’s surprise, the Sun had
lost all signs of its normal magnetic field; there was no north pole, no
south pole, just a field of constant intensity over the entire surface. No
one could begin to explain this and as Dr. Dmitriev states, this
“drastically changed the general model of heliomagnetism, and further
complicated the magnetologists’ analytic presentations.”
Arguably the ultimate energy release from our Sun comes from what are known
as coronal mass ejections. In these cases, the entire Sun releases a
super-flash of energy over much of its surface simultaneously, which travels
out into space as a halo-like expanding bubble that can contain up to ten
billion tons of electrified gas. [28]
Not surprisingly, Dr. Dmitriev
explains that with each passing year, these super-flashes are actually
traveling faster through space than ever before! This is the same reason as
why you can swim faster in water than molasses; interplanetary space has
become a better conductor. This shows us another consequence of our
heliosphere’s movement into an area of higher aetheric energy density.
So, on November 6, 1997 there was a huge coronal mass ejection rated at a
tremendous X level of 9.1, which NASA labels as being, quote, “severe.” For
72 hours, the Earth was charged with highly energetic protons. The
conventional models had predicted only one severe event for 1997 when in
fact there were three, which shows a 300-percent increase. And as Figure
8.12 shows, the severity of this event in November 1997 was later
outstripped by an even greater intensity of events in April through May of
1998.
Even more recently, from May 10th through 13th of 2000, the energy and dust
streaming out of the Sun known as the “Solar Wind”
abruptly shut off,
causing NASA to announce that this was, quote, “the most drastic and
longest-lasting decrease” ever observed. [25]
This created huge auroras on
Earth and caused the magnetic field to swell to between 500 and 600 percent
of its normal size. Many international satellites confirmed that this was
the single largest expansion of the Earth’s magnetic field they had ever
witnessed. The graphic on the left shows the Earth’s magnetic field in a
more compressed and energetic state, whereas the graphic on the right shows
a more relaxed state that allowed the expansion to occur.
The blue end of
the spectrum shows a higher degree of magnetic energy charge than the red.
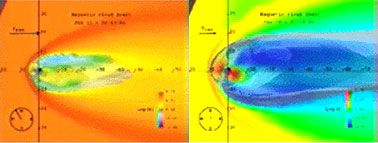
Figure 8.13 – 500-600% expansion of Earth’s magnetic field after solar wind
shutdown. (Courtesy NASA)
Then, on July 14, 2000, a massive solar flare shot directly at the Earth.
Protons from the Sun came to us in only fifteen minutes, which
NASA
indicated as being one of the fastest traveling speeds ever seen. [26]
The
speed of pure light itself is only less than twice as fast as this, at 8
minutes travel time from the Sun to the Earth. Normally, energetic protons
are not thought to travel this close to the observable speed of light. After
this flare, a coronal mass ejection was released that traveled fully 200
percent faster than conventional models expected.
A variety of satellites
and equipment were either disabled or shut down completely, including the
Japanese “Advanced Satellite for Cosmology and Astrophysics,” which was so
damaged that it was actually sent reeling blindly in its orbit.

Figure 8.14 – Surge in solar wind velocity after CME on Nov. 10, 2000.
(Courtesy NASA / SOHO)
On Nov. 8, 2000, a massive flare was soon followed by a
coronal mass
ejection that created one of the most intense radiation storms in decades.
[27]
The shock wave hit the Earth in only 31 hours, arriving on Nov. 10,
which is easily twice as fast as NASA scientists had expected. As we can see
in Figure 8.13, the speed of the solar wind surged from 600 to nearly 1000
kilometers per second as the shockwave passed, and the amount of high-energy
protons that were measured around the earth at this time spiked to a level
that was fully 100 thousand times greater than normal. Both the
SOHO and
Stardust satellites were not built to withstand such an impact, and were
rendered blind by the surge in radiation, which made them incapable of
“seeing” the stars they normally use for orientation. [27]
In the second week of February 2001, the Sun was still quite active,
continually bombarding the Earth with particles. At this time, NASA first
reported that the Sun’s magnetic poles were in the process of reversing, as
is normally expected at the end of every eleven-year solar cycle. As this
reversal began, the energy streaming into the Earth was again suddenly
increased, causing a number of very serious, very high magnitude
earthquakes. Most conventional scientists are still refusing to make such
obvious connections.
Between January 12 and 25, we saw a 6.9 earthquake on the coast of Alaska, a
7.6 earthquake in El Salvador [13],and a 7.9 earthquake in Gujarat, India.
[14] Then on Feb. 28, a 7.0 quake struck Seattle, Washington, and the
HAARP
program’s fluxgate magnetometer measured a sudden dip in the Earth’s
magnetic field strength from zero to –200 gamma as this earthquake occurred.
This shows how the pressure on the Earth’s luminous plasma core caused it to
temporarily eject a great burst of its energy to create the Seattle
earthquake. As the Earth released this sudden charge, there was a momentary,
major dip in the strength of its magnetic field, since the energy had been
released. This energy deficit was quickly replaced by the instreaming
pressures of solar torsion-field radiation, but the clear signature of this
event is visible in the magnetometer data.
Conventional theories believed that the Sun would become calmer once the
poles reversed, since this is what had always happened before. Yet, the
solar magnetic field steadily increased from March 18th to 27th of 2001,
with a very large solar flare then erupting on the 29th. This event was
followed by an Earth-directed CME that created significant aurora borealis
as it hit.
Then, soon afterward on April 2, 2001, solar flare number 9393 broke all
records for brightness and strength, weighing in at the unheard-of X-class
of 22; the measurement scale had previously only been designed to go to a
frightful maximum of 20. This flare was considered the largest of its kind
ever observed for at least 25 years, earning it the new name of
“mega-flare.” [43] Two consecutive coronal mass ejections, or CMEs, were
then released on April 10. The first CME traveled more slowly than the
second one, and this was named a “cannibal CME”, since the first CME was
consumed by the faster-moving second one.
Fortunately, the X-22 level of radiation from flare number 9393 did not
directly impact the earth, as it was nearly three times more powerful than
the March 1989 event, which deviated the Earth’s magnetic field by eight
degrees and totally shut down Canada’s power grid. A burst nearly three
times larger than this could literally disable the entire half of the earth
that it hit.
Again, two CMEs were released on April 10, 2001. Then, on April 11th, a rash
of severe tornadoes, some a quarter of a mile wide, ripped through the
Midwestern United States, affecting Kansas, Iowa, Oklahoma, Missouri and
Nebraska. Furthermore, a 5.7 earthquake occurred in Indonesia on April 7, a
5.9 earthquake on April 13 that destroyed 30,000 homes in China, and a 6.5
on April 15 off the coast of Japan. Most scientists would not be willing to
acknowledge the connection between the solar activity and events such as
severe weather and earthquakes, but again we see how the energy phenomena
are related. All these events clustered around the surge in solar activity
of April 10th.
And since this time, right through to the present, the solar activity has
not backed off, creating untold problems for the NASA scientists and far
more CMEs than were ever thought possible in previous models. This is not
being covered up or hidden by NASA or other space agencies; it is simply not
given very much attention in the media.
So, in short, this most recent solar
maximum cycle has been so unusually energetic that George Withbroe, Science
Director for NASA’s Sun-Earth Connection Program issued a statement saying
that, quote,
“This is a unique solar maximum in history. The images and data
are beyond the wildest expectations of the astronomers of a generation ago."
[41]
ENERGETIC CHANGES OF THE PLANETS
In our aetheric model, the Sun absorbs a majority of its surrounding energy
at the polar regions, and accelerates this energy out along the ecliptic
plane along its equator. So just as a balloon can only be inflated so far
before it will burst, the Sun is forced to release this pent-up energy
charge, caused by LISM energy density increases, with X-ray blasts, huge
solar flares, proton emissions and mass ejections.
This in turn causes the
interplanetary medium to become a better energy conductor, which then helps
to saturate the planets with higher and higher amounts of energetic charge.
So, if the planets indeed have cores of luminous plasma that can store and
release energy like what we have seen on the Earth, then we should expect
that similar energetic changes will be seen throughout the Solar System.
Dr. Dmitriev’s research on the planets shows accelerations in the speed of
magnetic pole shifts, climate changes, earthquakes and cyclones on Earth,
increased magnetic and plasma energy charges on other planets and changes in
their atmospheric qualities. In addition, some of the planets are actually
becoming noticeably brighter.
All of the following points are footnoted in Dmitriev’s study,
[15], unless otherwise noted:
8.7.1 PLUTO
Pluto, our outermost observed planet, has recently shown a significant,
unexpected increase in the amount of dark spots on its surface.
8.7.2 NEPTUNE
On the planet Neptune, some scientists believe that there has been a
complete magnetic polar shift in the recent past; as the Voyager satellite
passed by, the magnetic field was measured as being tilted nearly 50 degrees
away from the rotational pole. The event is considered to be recent simply
because such an imbalance would normally be expected to right itself in a
relatively short time, planetophysically speaking. Also, the intensity of
visible light emitted by Neptune has noticeably increased.
8.7.3 URANUS
Like
Neptune, Voyager noted that the planet Uranus also had a
magnetic field
that was shifted from the rotational axis, in this case by 55 to 60 degrees.
This simultaneous behavior between Neptune and Uranus is believed to be
possible because Neptune and Uranus are magnetically conjugate planets. Both
of them show this similar, anomalous discrepancy, which suggests that a
recent, still-imbalanced magnetic pole shift had taken place. Furthermore,
Uranus’ magnetosphere has shown an “abrupt, large-scale growth” in its
intensity.
8.7.4 SATURN
Brightly colored auroras have been recently observed on
Saturn, clearly
indicating energetic charge. Richard Pasichnyk has directly correlated these
brightness changes with solar activity. Most auroras cluster near the poles,
and this dramatic energy increase can be seen through infra-red photography.
8.7.5 JUPITER
Jupiter’s magnetic field has doubled in intensity as of 1992, and its total
brightness has also increased. Dmitriev and others believe that “Comet”
Shoemaker-Levy 9, which dramatically struck
Jupiter in July 1994, was
actually a series of luminous plasma formations – and this would explain why
a sequence of bright spheres traveled in a long, straight line.
Once this
“plasmoid train” struck Jupiter, there were “a series of new states and
processes” observed on Jupiter thereafter, inducing excessive plasma
generation. This plasma was then released “in the same matter as Solar
coronal holes,” and created a brightening of the radiation belts in the 13.2
and 36-centimeter bands, as well as creating large, anomalous aurora
formations.
In 1997, a tube of glowing plasma energy was observed to have formed between
Jupiter and the volcanic areas of its moon Io, at an
unbelievable
electromagnetic strength of one million amperes. This phenomenon presents
very strong evidence that volcanic activity is caused by energetic releases
of the luminous plasma in the core of a planet or moon. More recently, in
Feb. 2001 NASA scientists observed Io while it was being eclipsed from the
sun’s light by Jupiter, and they discovered that it has now become brighter
than ever before, noticeably glowing even though no sunlight was hitting it,
forming a “
plasma torus” around the sphere itself. [11]
8.7.6 MARS
The atmosphere of
Mars has shown definite signs of growth, as reported by
Dr. Dmitriev. These transformations have increased the quality of its
biosphere. Cloudy growth has been observed at the equatorial area, and there
has been an unusual increase in the concentration of ozone in the
atmosphere. Furthermore, in September 1997 the Mars Surveyor satellite
encountered a 200% increase in the density of the Martian atmosphere,
against what had been calculated from previous NASA data.
As Dmitriev
indicates, this greater atmospheric density bent one of the solar array arms
beyond the full and open stop, which caused the satellite to malfunction.
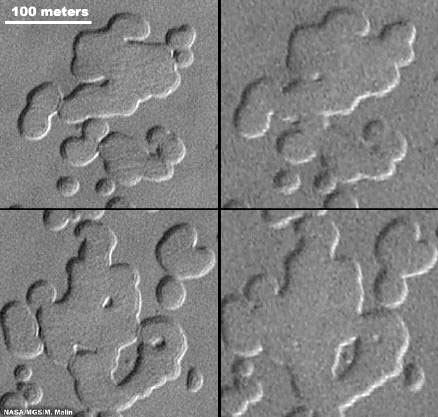
Figure 8.15 – Martian Polar Icecap Melting. (Courtesy NASA)
Even more recently, in December of 2001 NASA released photographic images
showing a major increase in the speed with which the Martian polar icecaps
are melting. [7, 3]
Figure 8.15 is easily the most dramatic of these images.
This “global warming” on Mars was completely unexpected by any conventional
model, but fits perfectly with the changes that we are encountering on the
Earth, caused by the energetic increase in the Earth’s luminous plasma core.
Naturally, the Bush Administration did not mention this in their recent
discussion of “global warming” on the Earth.
8.7.7 EARTH
We have already covered the Earth in detail, and in this current context we
should remember that there have been very clear signs that the atmosphere is
changing; this is occurring in the actual chemical composition of the
atmosphere as well as the increasing average cloud density that has been
observed. New charged particles are appearing in the Van Allen belts, with
qualities normally only seen in radiation from stars. Let us also remember
the overall 410-percent increase in catastrophes from 1963 to 1993, [15] the
400-percent increase in earthquakes from 1973 to 1998 and the ~500% increase
in volcanic activity from 1875 to 1993. [22]
8.7.8 EARTH’S MOON
According to a 1993 study by Boston University scientists, our
Moon has an atmosphere of sodium (natrium), reaching out to a height of 5,000 miles, or
9,000 kilometers. [32] During the Apollo missions, helium and argon atoms
were found in the Moon’s atmosphere, but Earth-based observations then added
sodium and potassium ions to the list in 1988. [18]
Dmitriev considers this
as evidence for the growth of a “first-stage” atmosphere, as it is about a
billion times less dense than Earth’s atmosphere by comparison; if the
Moon’s atmosphere were compressed into the temperature and pressure of the
Earth’s surface, it would all fit into a 210-foot cube. [34] More recently,
following the Leonid meteor shower in November 1998, a massive tail of
sodium gas with “distances of at least 500,000 miles from the moon, changing
its appearances over three consecutive nights” was observed. [5] [This is
believed to be caused by the many micrometeorites in the Leonids striking
the lunar surface, but could also be due to their energetic plasma effects.
This data on the evolution of the Moon’s atmosphere has almost always
aroused great questions at our seminars, and we decided to investigate
further for this book. Our research revealed that a sodium atmosphere was
actually first detected by Flynn and Medillo back in 1933. [29] This
technique was again duplicated with greater accuracy in 1994 by A. Potter,
T. Morsan and L. Gillian, revealing that the atmosphere extends all the way
down to the surface of the Moon. [29]
According to Prof. Theordore E. Madey
of Rutgers University,
…there is little data to support any one
explanation [for the creation of the Moon’s atmosphere] and no
general agreement about which processes are the most important. [21]
Dr. D.E. Shemansky again breaks with the pack when he mentions a paper
coauthored with T. Morgan on “the evolution of the Lunar atmosphere,” again
hinting that the amount of sodium and potassium concentration has indeed
increased since the time of the Apollo missions. [35]
T.E. Madey and
B.V.
Yakshinkskiy have proposed “charged particle sputtering by the solar wind”
as one possible source for this atmosphere, since it must be continually
resupplied. [21] Dmitriev’s model suggests that this lunar atmospheric
evolution is being triggered by our movement into a higher energetic density
of the LISM, which then increases solar activity.
8.7.9 VENUS
Significant physical, chemical and optical changes are being observed on
Venus. This includes a sharp decrease in the amount of sulfur-containing
gases, a reversal in the areas of light and dark spots and a significant
increase in its overall brightness.
One mainstream article on these changes
by Kenneth Chang in the New York Times, 1/28/01, said: [9]
Every time [scientists] take a look [at
Venus,] they seem to see something
different, with phenomena appearing or disappearing like the smile of the
Cheshire Cat. In November 1999, researchers from S.R.I. International and
Lowell Observatory pointed the 10-meter Keck telescope on Mauna Kea, Hawaii,
toward [the night side of] Venus for eight minutes and saw the distinctive
green glow of oxygen atoms.
"It was a total surprise," said Dr. Thomas G. Slanger, a scientist at S.R.I. and lead author of a paper in the current
issue of Science.
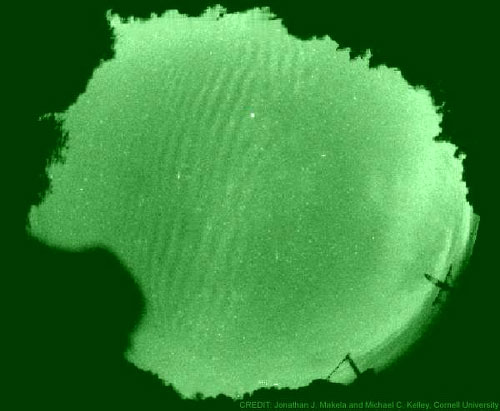
Figure 8.16 – Green Glow on the night surface of Venus. (Courtesy NASA /
Cornell Univ.)
Though articles on these anomalous energetic increases of Venus have indeed
emerged in the mainstream press, [8] thus far no one in the Western media
has ever combined this data to see it as another function of changes that
are occurring throughout the entire heliosphere.
8.7.10 MERCURY
Like the Moon, Mercury has also been observed to have a thin atmosphere of
sodium, potassium and other elements. Conventional theories have a hard time
with this atmosphere, since Mercury is so close to the Sun – but
nevertheless it is there to be measured. This too may indicate a
“first-stage” generation of new atmosphere. [21]
Pasichnyk reports that
Mercury has also been observed to have polar ice, which is considered
impossible given its proximity to the Sun.
CONCLUSIONS - THE TRANSFORMATION OF THE HELIOSPHERE
The information that has been presented in this chapter suggests that we are
indeed moving towards an “Omega Point” of energetic change. In our
next
article
The Ultimate Secret of the Mayan Calendar,
[40] we present evidence
from Dr. Sergey Smelyakov that allows us to pinpoint exactly when our
movement into this new area will be complete. [36]
This data has never
before been written about by any other English-speaking authors. In the
article, we describe how the Mayan Calendar time cycle of ~5,125 years is
divided up by the “phi” ratio into “Auric” time periods, which become
considerably shorter in length, leading up to a final “implosion” point. As
each increasing time cycle is reached, massive energetic effects occur on
the Earth. All 21 of the largest earthquakes since 856 AD have fallen
exactly on these “bifurcation points,” caused by our rapid passage from a
lower-energy to higher-energy state in the LISM. Nearby supernova explosions
of stars have also occurred at these points. [40]
The aetheric model suggests that at the edges of the spiraling,
pinwheel-shaped “Parker Spiral” formations in the galaxy, there will be
discrete layers between one level of aetheric density and another, much as a
line will form between oil and water. This boundary area naturally creates a vibrational disturbance, which in turn ripples through the aether in either
direction based on the simple “phi” ratio.
Each time we pass through another
turning-point in the Auric cycle, we are entering into a discretely higher
energetic area of the LISM. Most interestingly, the total population of the
Earth has also been shown to multiply in exact lock-step with the phi ratio,
centering on these points. [36] New religions, spiritual faiths and
time-measuring calendar systems are born during these times, as well as the
collapsing of large empires followed by relatively quick political
developments thereafter. The next two “bifurcation points” where such events
could occur are 2003 and 2008 – not so far away.
This is one link in a vast chain of evidence to suggest that as aetheric
energy density increases, human consciousness increases as well. This can
also be directly associated with spiritual advancement. Part Two of this
book is dedicated to fully establishing this connection between aetheric
energy, biology, consciousness and
spirituality.
It is also important to
mention the date for the final “implosion point” that
Dr. Smelyakov’s
marvelous cycle collapses into:
Dec. 21, 2012 AD
– the end-date for the Mayan Calendar.
Incidentally, it is also during this same time period that
the Earth comes
into perfect “precessional” alignment with the center of the Galaxy, which
we now know has a redshift that is ten times higher than the observable
Universe in conventional models. We shall explore these connections in more
detail in Part Two. [Smelyakov’s cycle is completely different from Terence
McKenna’s “Timewave Zero” model, and shouldn’t be confused with it or seen
as supporting it.]
For now, the bottom line is this:
We have the proof. We know what is happening. We know why it is happening.
We know how it is happening. And we know precisely when “it” will happen.
With the forthcoming information in Part Two, we can also make a very good
case for exactly what “it” will do.
As one voice for the ancient traditions,
the Bible referred to this as the coming of the “New Heaven and New Earth,”
a utopian Golden Age for humanity where each of us who choose to participate
will have abilities above and beyond those displayed by Jesus and other
masters:
“As I do these things, so shall ye do them, and greater things…”
(John 14:12)
REFERENCES
1. Aspden, Harold. Energy Science Tutorial Note 10: Tifft’s Discovery.
(1997) URL: http://www.energyscience.co.uk/tu/tu10.htm
2. Aspden, H. & Eagles, D.M. Aether Theory and the Fine-Structure Constant.
(1972) Physics Letters, 41A, 423-424. URL: http://www.energyscience.co.uk/tu/tu10.htm
3. Bara, Michael & Hoagland, Richard. Global Warming on Mars? The
Hyperdimensional Connection. (2001) URL: http://www.enterprisemission.com/warming.htm
4. Blake, J.R. The Van-Allen radiation belts – two newly observed
populations. (1994) Absr. Spring Meet., Baltimore, MD, May 23-28. EOS, 1994,
vol. 75 no. 16.
5. Boston University / American Geophysical Union. Lunar sodium tail
discovered. (1999) URL:
http://www.astronomynow.com/breaking/9906/15moontail/
6.
Braden, Gregg.
Awakening to Zero Point: The Collective Initiation. (1997) Radio
Bookstore Press, Bellevue, WA. ISBN: 1-889071-09-9.
7. Britt, R.R. Mars Ski Report: Snow is Hard, Dense and Disappearing. (2001)
URL:
http://www.space.com/scienceastronomy/solarsystem/mars_snow_011206-1.html
8. Britt, R.R. Venus: No Lightning, But a Strange Green Glow. (2001) URL:
http://www.space.com/scienceastronomy/solarsystem/venus_lights_01022.html
9. Chang, Kenneth. (Anomalous brightness increases of Venus) (2001) New York
Times, Jan. 28, 2001. URL:
http://www.rense.com/general7/mysterious.htm
10. CNN. (Tornado activity after April 10, 2001 solar activity) (2001) URL:
http://www.cnn.com/2001/WEATHER/04/12/stormdamage.ap/index.html
11. CNN. (Brightness increase of Io) (2001) URL:
http://www.cnn.com/2001/TECH/space/02/07/io.eclipse/index.html
12. CNN. (Brightness increase of Jupiter) (2001) URL:
http://www.cnn.com/2000/TECH/space/12/15/hubble.pic/index.html
13. CNN. (Earthquake of El Salvador, Jan. 2001) (2001) URL:
http://www.cnn.com/2001/WORLD/americas/02/13/salvador.quake/index.html
14. CNN. (Earthquake of Gujarat, India, Jan. 2001) (2001) URL:
http://www.cnn.com/2001/WORLD/asiapcf/south/01/29/india.quake.03/index.html
15. Dmitriev, Aleskey.
Planetophysical State of the Earth and Life. (1997)
URL: http://www.tmgnow.com/repository/global/planetophysical.html
16. European Southern Observatory. Astron. Astrophys. 317, 193-202 (1997)
URL: http://194.190.131.172/~izmod/Papers/ILM97/sc1.htm
17. Hutton, William. Coming Earth Changes: The Evidence. (1998)
18. Leifert, Harvey. Investigating the Moon’s atmosphere. (1998) URL: http://www.agu.org/sci_soc/prrl/prrl9826.html
19. American Geophysical Union News, Release No. 98-26. (1998) URL:
http://www.agu.org/sci_soc/prrl/prrl9826.html {sodium and potassium added to
list in 1988}
20. Lockwood, Mike. (230% increase in solar magnetic field since 1901)
(1998) URL: http://ascension2000.com/solarmag.html
21. Madey, T.E. T.E. Madey’s Research and Co-Workers. URL: http://www.physics.rutgers.edu/lsm/pages/madey_group.html {solar wind on
lunar atm}
22. Mandeville, Michael. (Earthquake and Volcanism Increases)
http://www.michaelmandeville.com
23. Mewaldt, R.A. Re-Accelerated Solar Wind – An Additional Source of
Anomalous Cosmic Rays? (1999) Caltech, Pasadena, CA, 91125, USA. URL: http://www.icrc1999.utah.edu/~icrc1999/root/vol7/s4_3_07.pdf
24. NASA. (Solar activity min-max image comparison) (2000) URL:
http://science.nasa.gov/headlines/y2000/ast22dec_1.htm
25. NASA. (May 10-13 2000 Solar Wind shutdown, 500-600% increase in Earth
magnetic field) (2000) URL:
http://science.nasa.gov/newhome/headlines/ast13dec99_1.htm
26. NASA. (July 14, 2000 CME, 200% faster traveling speed, satellite damage)
(2000) URL:
http://science.nasa.gov/headlines/y2000/ast22dec_1.htm;
http://science.nasa.gov/headlines/y2000/ast14jul_2m.htm
27. NASA. (Nov. 8, 2000 solar radiation storm, double traveling speed,
100,000 times increase in proton flux around Earth) (2000) URL:
http://science.nasa.gov/headlines/y2000/ast22nov_1.htm
28. NASA. (Properties of CMEs, up to 10bn tons electrified gas) (2000) URL: http://science.nasa.gov/headlines/y2000/ast13sep_1.htm
29. Odenwald, Sten. Archive of Astronomy Questions and Answers: Does the
Moon have an atmopshere? URL: http://itss.raytheon.com/cafe/quadir/q652.html
{Flynn Medillo 1933}
30. Pasichnyk, Richard. (Redshift anomalies) URL: http://www.livingcosmos.com/quasar.htm
31. Pasichnyk, Richard. The Vital Vastness – Volume Two: The Living Cosmos.
(2002) Writer’s Showcase / Iuniverse, Inc. ISBN: 0-595-21086-4; URL: http://www.livingcosmos.com
32. Ray, C. Claiborne. Science Q&A: Lunar Atmosphere. URL:
http://www.think-aboutit.com/Moon/science_q__a_lunar_atmosphere.htm
33. Rutgers University. Lunar Atmosphere Reproduced in a Lab. (1999) Artemis
Society International. URL:
http://www.asi.org/adb/06/09/04/1999/08/news-19990814.html {Yakshinskiy and
Madey}
34. Seybold, Calina C. Characteristics of the Lunar Environment. (1995) URL: http://www.tsgc.utexas.edu/tadp/1995/spects/environment.html {lunar 210 ft
cube}
35. Shemansky, D.E. Vitae. University of Southern California. URL: http://ae-www.usc.edu/bio/dons/ds_biosk.html
36. Smelyakov, Sergey and Karpenko, Yuri. (1999) The Auric Time Scale and
the Mayan Calendar: Demography, Seismicity and History of Great Revelations
in the light of the Solar-Planetary Synchronism. ISBN: 966-7309-53-3; URL: http://www.timeofglobalshift.com/Science/Ulti_Secr.html
37. Talbot, J. Plasma Laser Stars 1976-1977 Papers. URL:
http://home.achilles.net/~jtalbot/V1976b/index.html {Fig 8.5}
38. Talbot, J. Quasar Clusters – No Quasar Lensing! URL: http://home.achilles.net/~jtalbot/references/lenses.html {Fig 8.6}
39. Wilcock, David.
Convergence III. (2001)
40. Wilcock, David. The Ultimate Secret of the Mayan Calendar. (2002) Time
of Global Shift National Seminar Tour. URL: http://www.timeofglobalshift.com/Science/Ulti_Secr.html
41. Withbroe, George. (Solar Changes) (2000) NASA. URL: http://science.nasa.gov/headlines/y2000/ast22dec_1.htm
42. Zank, Gary P. Could the Heliosphere Collapse? (1999) Bartol Institute,
University of Delaware. URL: http://www.npaci.edu/successes/1999_helio.html
43. (April 2001 Mega-Flare) URL:
http://www.maj.com/sun/noaa.html ;
http://news.bbc.co.uk/hi/english/sci/tech/newsid_1249000/1249403.stm
44. Time of Global Shift National Seminar Tour. URL:
http://www.timeofglobalshift.com
45. Heilprin, John. White House Warns on Climate Change. (2002) The
Washington Post, June 4, 2002. URL: http://www.washingtonpost.com/wp-dyn/articles/A58119-2002Jun4.html
46. Drudge, Matt. Bush Admin U-Turn on Global Warming. (2002) [Note: This
link is transient and may only exist a short time on the website.] URL:
http://www.drudgereport.com/flash91.htm
47. Bara, Mike and Hoagland, Richard. Enterprise Mission Statement on the
Coming of Sitchin’s “Nibiru” in Spring, 2003. (2002) URL: http://www.enterprisemission.com/zeta.htm
|